Kruskal-Wallis Test
The Kruskal–Wallis Non Parametric Hypothesis Test (1952) is a nonparametric analog of the one-way analysis of variance. It is generally used when the measurement variable does not meet the normality assumptions of one-way ANOVA. It is also a popular nonparametric test to compare outcomes among three or more independent (unmatched) groups.
Consider the Mann–Whitney test for just two groups instead of the Kruskal–Wallis test. Like the Mann-Whitney test, this test may also evaluate the differences between the groups by estimating the differences in ranks among the groups.
Generally in the ANOVA test, the assumption is that the dependent variable is drawn from a normally distributed population and also assumes that common variance across groups. But, in Kruskal-Wallis Test, there is no necessity for these assumptions. Therefore, this test is the best option for both continuous as well as ordinal types of data.
Assumptions of the Kruskal-Wallis Test
- All samples are randomly drawn from their respective population.
- Independence within each sample.
- The measurement scale is at least ordinal.
- Mutual independence among the various samples
- Note: This test evaluates differences in mean ranks and that interpreting these differences as differences in medians requires the assumption of similarly shaped distributions across groups. If you’re not comparing similarly shaped distributions, the test may detect differences due to those inconsistent shapes rather than the differences between the central tendencies.
Uses of Kruskal-Wallis Non Parametric Hypothesis Test Test
The Kruskal-Wallis test can be used for any industry to understand the dependent variable when it has three or more independent groups. For example, this test helps to understand the student’s performance in exams. While the scores are measured on a scale from 0-100, the scores may vary based on the exam anxiety levels (low, medium, high, and severe -in this case, four different groups) of the students.
Procedure to conduct Kruskal-Wallis Test
- First pool all the data across the groups.
- Rank the data from 1 for the smallest value of the dependent variable and the next smallest variable rank 2 and so on… (if any value ties, in that case, it is advised to use mid-point), N being the highest variable.
- Compute the test statistic
- Determine critical value from the Chi-Square distribution table
- Finally, formulate a decision and conclusion
This reliance on ranks can make the Kruskal–Wallis test less powerful than a one-way ANOVA, especially when the assumptions of ANOVA are met.
Calculation of the Kruskal-Wallis Non Parametric Hypothesis Test
The Kruskal–Wallis Non Parametric Hypothesis Test compares differences in mean ranks among k groups (k > 2). Interpreting these differences as differences in medians requires the assumption of similarly shaped distributions across the groups.
The null and alternative hypotheses for the Kruskal-Wallis test are as follows:
- Null Hypothesis H0: Population medians are equal
- Alternative Hypothesis H1: Population medians are not all equal
As explained above, the procedure for the Kruskal-Wallis test pools the observations from the k groups into one combined sample, and then ranks from lowest to highest value (1 to N), where N is the total number of values in all the groups.
The test statistic for the Kruskal Wallis test (mostly denoted as H) is defined as follows:
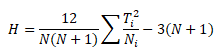
Where Ti = rank sum for the ith sample i = 1, 2,…,k
The Kruskal-Wallis test is more robust to outliers than parametric tests because it operates on ranked data rather than raw values. As a result, extreme values (high or low) tend to have less impact on the test statistic. However, in smaller datasets, even a few extreme values can still shift the rank distribution enough to influence the results, especially if those outliers affect the relative ordering between groups.
Note on Sample Sizes:
The Kruskal-Wallis test is a non-parametric alternative to one-way ANOVA and relies on ranks rather than raw values. While it doesn’t assume normality, it does require sufficient sample size for reliable results, especially when interpreting the approximate chi-square distribution of the test statistic.
To ensure validity:
- Minimum per group:
Aim for at least 5 observations per group, but:- Prefer 10+ per group for more stable and reliable p-values.
- 20+ per group is ideal when possible, especially with tied ranks or unequal variances.
- Minimum number of groups:
The test requires at least 3 groups to test for differences in medians. - Avoid small group sizes with ties or skewed data:
The chi-square approximation becomes unreliable with:- Heavily tied data
- Unequal group sizes, especially when some groups are small
- Small samples (<5 per group):
- The p-value may be inaccurate under the chi-square approximation.
- In such cases, consider using exact p-values or Monte Carlo simulations (some statistical packages support this).
Rule of Thumb Summary
| Sample Size per Group | Validity of Chi-Square Approximation |
|---|---|
| < 5 | Not recommended |
| 5–9 | Acceptable but borderline |
| 10–19 | Generally reliable |
| ≥ 20 | Strongly recommended for robustness |
Important Note on Interpretation:
While many texts describe the Kruskal-Wallis test as comparing group medians, this is only strictly valid if the distributions across groups are similarly shaped and scaled. In practice, the test detects differences in the distribution of ranks, which can result from differences in location (medians), spread (variability), or shape. Technically, the Kruskal-Wallis test is a test of stochastic dominance, not median equality. That means it’s possible to have equal medians across groups and still reject the null hypothesis if other aspects of the distributions differ. Always inspect distribution shapes before interpreting results solely in terms of medians.
Example of Kruskal-Wallis Non Parametric Hypothesis Test
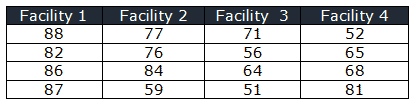
In a manufacturing unit, four teams of operators were randomly selected and sent to four different facilities for machining techniques training. After the training, the supervisor conducted the exam and recorded the test scores. At 95% confidence level does the scores are same in all four facilities?
- Null Hypothesis H0: The distribution of operator scores are same
- Alternative Hypothesis H1: The scores may vary in four facilities
Rank the score in all the facilities
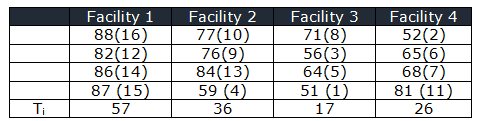
N=16
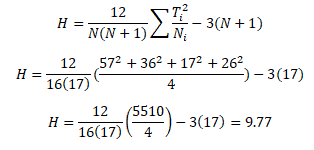
While for a right-tailed chi-square test with a 95% confidence level, and df =3, the critical χ2 value is 7.81
Critical values of Chi-Square Distribution
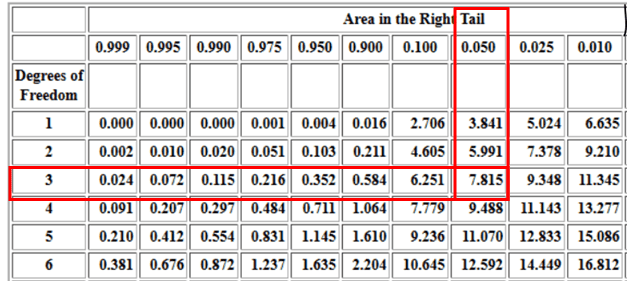
The calculated χ2 value is greater than the critical value of χ2for a 0.05 significance level. χ2calculated >χ2critical hence, you reject the null hypotheses
So, there is enough evidence to conclude that difference in test scores exists for four teaching methods at different facilities.
Six Sigma Black Belt Certification Kruskal-Wallis Test Questions:
Question 1: In an organization, management conducted a study comparing Purchase, Marketing, Quality, and Production groups on a measure of leadership skills. Which of the following test would an organization choose?
(A) Mood’Median test
(B) Kruskal-Wallis test
(C) Mann-Whitney U test
(D) Friedman Rank Test
Question 2: Which of the following nonparametric test use the rank sum?
(A) Runs test
(B) Mood’Median test
(C) Sign test
(D) Kruskal-Wallis test
When you’re ready, there are a few ways I can help:
First, join 30,000+ other Six Sigma professionals by subscribing to my email newsletter. A short read every Monday to start your work week off correctly. Always free.
—
If you’re looking to pass your Six Sigma Green Belt or Black Belt exams, I’d recommend starting with my affordable study guide:
1)→ 🟢Pass Your Six Sigma Green Belt
2)→ ⚫Pass Your Six Sigma Black Belt
You’ve spent so much effort learning Lean Six Sigma. Why leave passing your certification exam up to chance? This comprehensive study guide offers 1,000+ exam-like questions for Green Belts (2,000+ for Black Belts) with full answer walkthroughs, access to instructors, detailed study material, and more.

Comments (13)
The Kruskal-Wallis test is not about the equality of medians. It’s about the stochastic dominance. If the distributions within groups are IID, then indeed (and ONLY then) such interpretation holds. Otherwise, the difference may be caused either difference in locations or scales. Kindly please correct it, as people then use the KW or MW(W) tests to detect shift in locations and get totally surprised, how that’s possible to have numerically equal medians and H0 rejected. Both tests fail in general (appropriate sources available over the internet).
IID means?
Independent and identically distributed.
Good note. Updated the text to reflect this. Thank you.
N should be 16 not 12.
Louisa,
The N in the example is 16. The 12 is a constant of sorts after reduction in this circumstance (see example here.)
Best, Ted.
what is the difference between the kruksal walistest and themood median test ,
Both of them treat more than 2 non parametric variable
Hi Youssef Boudoudouh,
When the data are non normal or the data points are very few to check if the data are normal or not and have more than two populations then we have to use Moods Median or Kruskal-Wallis test , the key difference is Moods median handles the outliers but Kruskal-Wallis test is more powerful than Moods Median.
Thanks
In the example that is worked out on this page, why is it considered a right-tailed test and not a two-tailed test?
I’m having trouble understanding why the X2 critical is 7.815 and not 9.348.
Critical values for the Kruskal-Wallis test follow χ2 . The χ2 test is one-sided tests because we never have negative values of χ2. For χ2, the sum of the difference of observed and expected squared is divided by the expected ( a proportion), thus chi-square is always a positive number or it may be close to zero on the right side when there is no difference. Thus, this test is always a right-sided one-sided test.
Thanks
That makes much more sense now. Thank you!
In both the videos that was attached as an example has calculated test statistic less than critical value. In Mann-Whitney test video, hypothesis is rejected whereas in Kruskal test video, outcome is cannot reject hypothesis. Can you please explain?
https://www.youtube.com/watch?v=BT1FKd1Qzjw&ab_channel=EugeneO%27Loughlin
https://www.youtube.com/watch?v=q1D4Di1KWLc&ab_channel=EugeneO%27Loughlin
Hi Laki,
its reverse in case of only mann whitney..always remember that and author mentioned same in the video.
There are two versions of the Mann-Whitney U test, one for small samples (i.e., when n < 20 for each group) and one for large samples. It is important to remember the null hypothesis for this test, and to differentiate it from the nulls for the t-test and the median test. Please find below links for better clarity https://psych.unl.edu/psycrs/handcomp/hcmann.PDF
https://sphweb.bumc.bu.edu/otlt/mph-modules/bs/bs704_nonparametric/bs704_nonparametric4.html
Thanks