Industry 4.0 has brought many great advancements to manufacturing processes. It’s like a revolution in manufacturing. However, the data collected in Industry 4.0 is very complicated and cannot be easily analyzed using the traditional Six Sigma statistical tools that rely mostly on least squares techniques. So, researchers created Multivariate Six Sigma, a distinct process improvement methodology for Industry 4.0. Here’s a Case Study on Updating Six Sigma for Industry 4.0.
A recent study conducted at International Flavors & Fragrances Inc in Spain offers a guide to implementing Multivariate Six Sigma’s DMAIC methodology. The study was overseen by Joan Borràs-Ferrís, Daniel Palací-López, Alberto Ferrer, and Larissa Thaise da Silva. The study focuses on the batch production process of one of the chemical plant’s star products.
Six Sigma has a proven track record of success in various industries. However, the tools employed best suit situations with restricted data and variables. Also, due to the nature of the Industry 4.0 data collected, the team needed to use alternative methods like PLS and PCA in this project.
Here’s how the researchers implemented the multivariate Six Sigma methodology of DMAIC to improve the manufacturing process at the chemical plant.
Updating Six Sigma for Industry 4.0
As mentioned, the researchers want to use new techniques better suited for Industry 4.0 in this case study. So, they suggest using latent variable-based techniques alongside the usual DMAIC framework. In the past, people used classical statistical techniques like multiple linear regression (MLR) in DMAIC. However, they mainly worked with experimental designs because they lacked data.
However, in Industry 4.0, we have complex data characteristics, so we need new approaches to handle them. Researchers have integrated multivariate statistical tools such as PCA and discriminant analysis into the Six Sigma toolkit. Researchers use latent variable regression models (LVRM) as another advanced technique. Building models using them can aid in process monitoring, fault detection, diagnosis, process understanding, troubleshooting, and optimization.
Using LVRM, such as partial least squares (PLS), can be especially helpful in Industry 4.0 scenarios, like batch production processes. The team’s goal in this research is to predict data patterns and identify valuable relationships. These insights help improve and optimize the process. Using LVRM techniques, the team can better use all the available data.
The researchers used different software packages for their data analysis:
- The Multivariate Exploratory Data Analysis (MEDA) Toolbox (which works with Matlab) checks variables and fills in any missing data within a batch.
- The MVBatch Toolbox (also for Matlab) synchronizes the batches.
- Aspen ProMV was used for calibrating and analyzing the synchronized batch data.
- They use Minitab to create control charts.
DMAIC Phases: Updating Six Sigma for Industry 4.0 Case Study
This section shows the results of applying each DMAIC step to the process, each having its subsection. The tools used in the DMAIC cycle differ from traditional approaches. However, the purpose of each stage remains the same.
Define Phase
The focus of the define phase is on identifying opportunities for improvement. These may include increasing revenue, reducing expenses, or adopting eco-friendly practices. First, the team needs to identify the issue and understand its workings. Then, they must evaluate its significance and find the right help.
The project team included Six Sigma Black Belts. Two important people from the company and three technical experts supported them. They expected the project to take over six months. However, they couldn’t experiment in the lab or at the plant due to the inability to stop production. So they had to use data from the past.

This Six Sigma project focused on one of the top products at International Flavors & Fragrances Inc’s chemical plant. They noticed the product’s purity was becoming more variable, especially once every four batches. The product’s average purity has dropped by about 1% since September 2014. This has cost them over 100,000 € per year compared to previous years.
Measure Phase
The project team collected data to evaluate the initial situation and identify potential root causes for the project’s issues during the measure phase. As a result, they had data from 17,147 batches produced in two reactors over nine years.
Here are the details of the data they collected:
- At point (1), the average values of three process variables (x1 to x3) were measured for each batch.
- Amounts (x4 to x7) and proportions (x8 to x11) of reactants, measured at point (2)
- Four categorical variables indicating reactor (x12), use of equipment (x13), recovery of excess reactant (x14), and type of Premix (x15), registered at points (1) and (2)
- Evolution over time for 11 process variables (x16 to x26), measured at point (1)
- Information on 10 CQC (y1 to y10), including purity (y8) and the total amount of crude (y4 and y6), measured/registered at points (3) and (4)
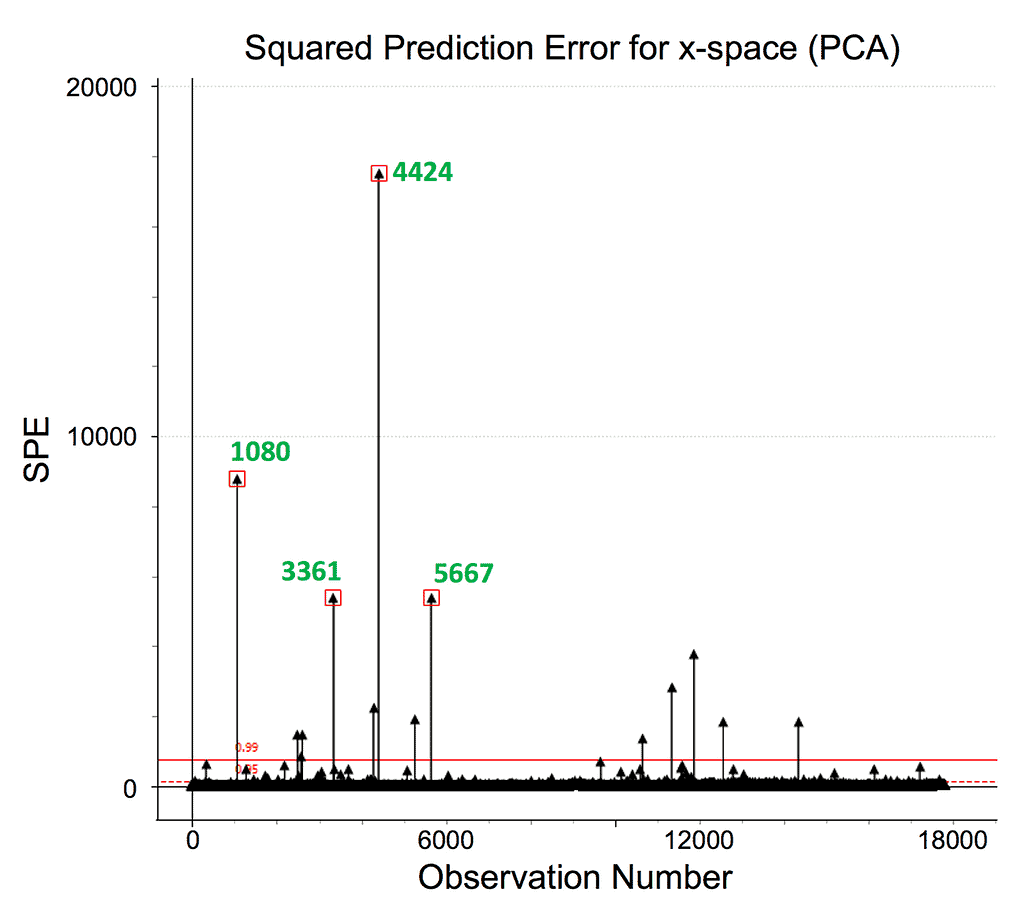
They called the first three groups of variables ‘summary variables’ because they provide summarized information about each batch. The fourth group, named ‘trajectory variables’, exhibits differences in the evolution of process conditions among batches.
The team looked carefully at the data to see why some numbers were higher or lower than others. they fixed some of the mistakes and removed the outliers. This made their dataset a bit smaller. They also checked some other numbers but didn’t find any outliers there. They used some numbers that were sometimes different.
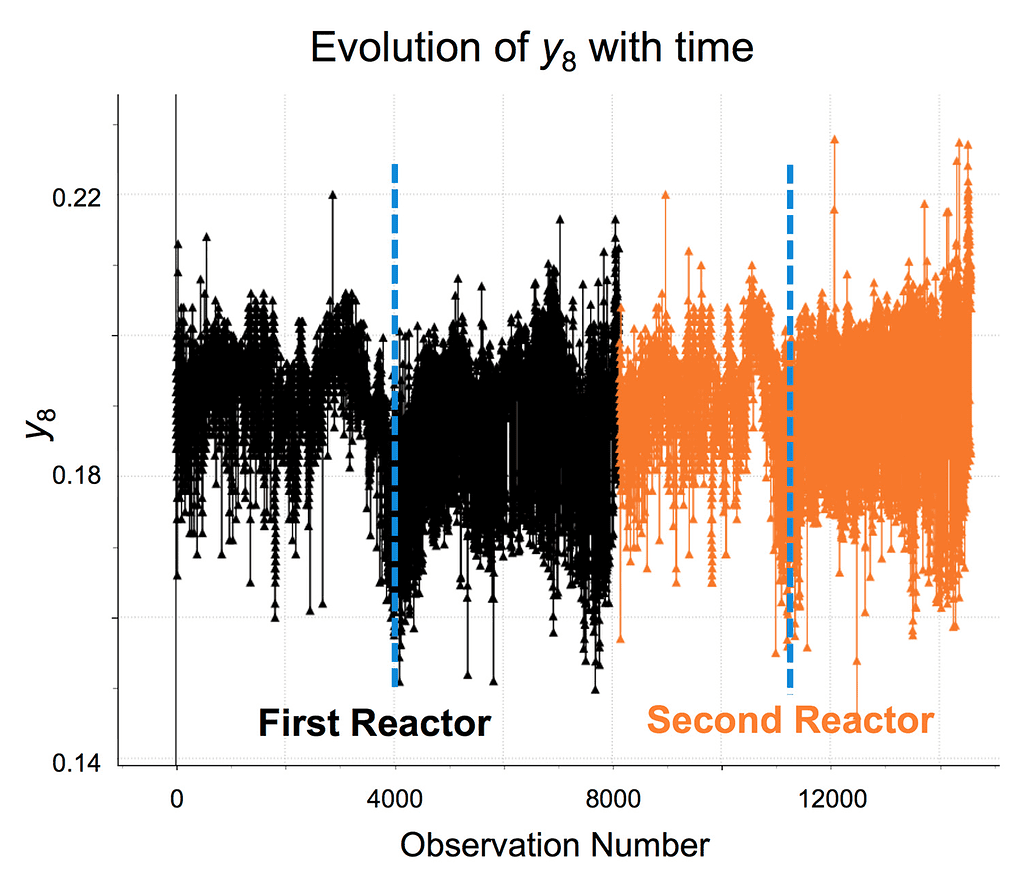
The researchers found that after September 2014, the average value for y8 was slightly lower than before, and the numbers varied more. This was a real change, not just a coincidence. The people here said they had made some changes to the process around that time, which might explain what they found.
Analyze Phase
The researchers aimed to determine which process parameters affect the product’s purity and how they are related:
- They used a PCA model to examine the correlation structure between the summary variables and CQC in the database. This helped us detect clusters of batches that operated similarly in the past.
- They used a PLS-regression model to predict CQCs from summary variables and determine which factors affect the product’s purity.
- They used a PLS-DA to analyze trajectory variables and see which ones are responsible for the differences in performance between batches.
In this analysis, the team examined how different process batches are related. They wanted to see if any groups of batches were similar regarding their results. The researchers used a model that looked at different variables affecting the process. They found that they could use a model with five variables to get a good idea of how the batches were related to each other.
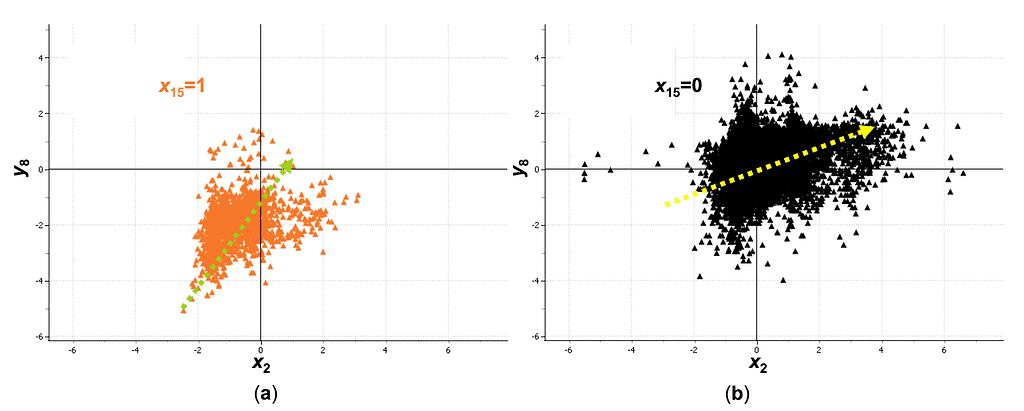
The team also looked at a graph showing how each variable relates to the process. This graph helped them see which variables were related to each other positively or negatively. The team found that some variables were related positively while others were related negatively. Then, they used graphs to help them see these relationships more clearly.
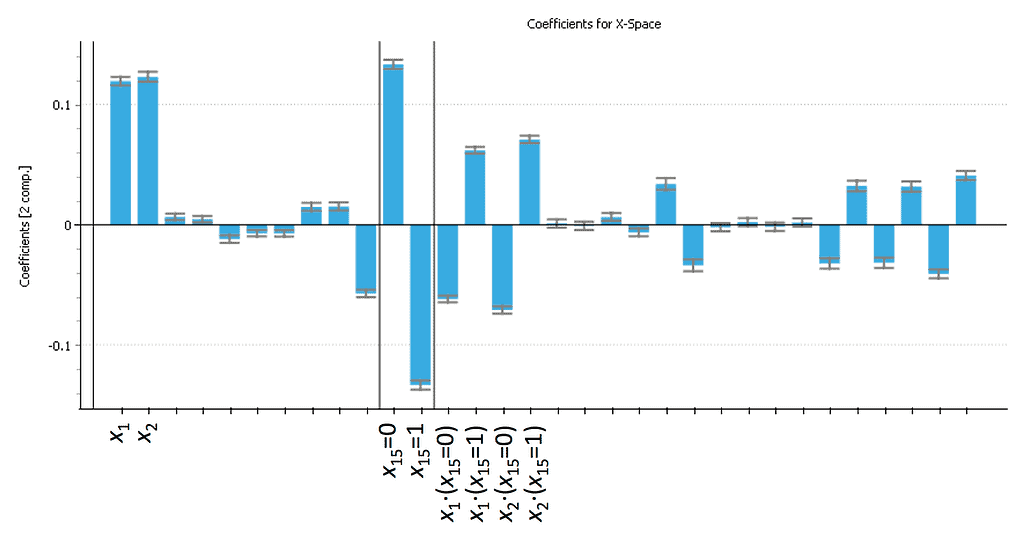
One interesting thing they found was that one of the variables, called x15, was related to a variable called y8 in a positive way. This relationship changed when x15 had a different value. This means that how x15 is used affects how y8 turns out. They also found other interesting relationships between the variables to help them understand the process better.
Improve Phase
The team in charge of the production process discovered a problem causing the desired product’s loss of purity and volume. They discovered that feeding Premix 2 into the reactor might be the cause. They compared the data and found that y8 was 1.9332% lower and had a higher standard deviation when x15 was one compared to 0. Historical data confirm that the problem started with the first use of Premix 2.
The technicians initially doubted that the modification was the cause of the problem. However, a more in-depth investigation revealed that either contaminated Premix 2 or unregistered variables were at fault. Therefore, they corrected the problem with Premix 2 to fix the issue. The treatment of both Premix 1 and 2 was standardized. The solution achieved its aim with estimated benefits/savings exceeding 140,000 €/year, surpassing the initial ‘Define’ phase estimation.
Control Phase
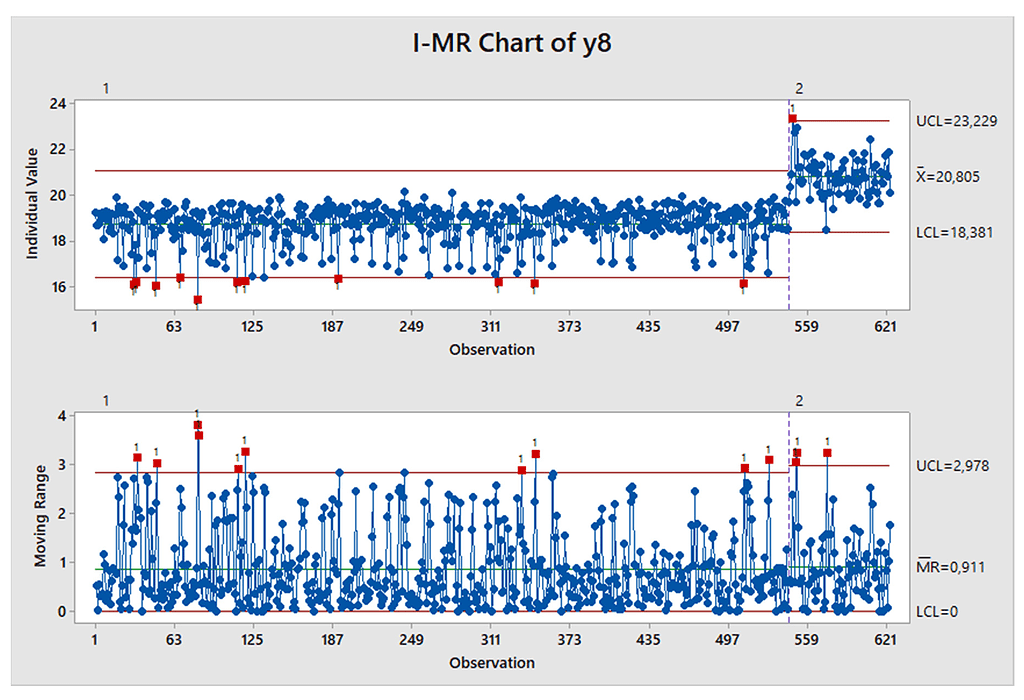
First, the team found out why productivity was decreasing. Then, they set up a monitoring system at the plant to identify any problems with Premix 1 and Premix 2. The designers created the system to save time and money by circumventing costly tests. Before they started this project, the team didn’t have this kind of system, so they didn’t notice the issue earlier.
Multivariate statistical analysis techniques quickly detect batches not up to standard and narrow down the possible causes for such events. This helps the monitoring scheme to function effectively.
Updating Six Sigma for Industry 4.0 Case Study Conclusions
The traditional statistical tools used in Six Sigma have limitations when problem-solving using data from Industry 4.0. Many data need values and hundreds or thousands of highly correlated variables. They used principal component analysis (PCA) to reduce data dimensions and detect patterns, trends, clusters, and outliers. But, classical predictive models like multiple linear regression (MLR) and machine learning (ML) may not show causal relationships between input and output variables.
Even with daily production data, they can use partial least squares (PLS) regression for causal models. Using these methods in Six Sigma can improve problem-solving and decision-making in Industry 4.0, called Multivariate Six Sigma.

