Sign Test
The 1 Sample Sign Non Parametric Hypothesis test was invented by Dr. Arbuthnot a Scottish physician in the year 1710. The Sign test is used to test the null hypothesis that the median of a distribution is equal to some hypothesized value k. The test is based on the direction or the data are recorded as plus and minus signs rather than numerical magnitude, hence it is called the Sign test.
Use sign test for the following:
- To determine the preference for one product over the other
- Conduct a test for the median of a single population (one sample sign test)
- To perform a test for the median of paired difference using the data from two dependent samples.
One Sample Sign Test
The One-sample Sign Test simply determines a significance test of a hypothesized median value for a single data set. The 1 sample sign test is a Non Parametric Hypothesis test used to determine whether a statistically significant difference exists between the median of a non-normally distributed continuous data set and a standard. This test basically concerns the median of a continuous population.
The 1 sample sign test is to compare the total number of observations less than (-ve) or greater than (+) the hypothesized value. The 1 sample sign test is similar to the One-sample Wilcoxon Signed-rank test but less powerful than the Wilcoxon signed test.
The One-sample Sign Test is a non parametric version of one sample t-test. Similar to one sample t-test, the sign test for a population median can be a one-tailed (right or left-tailed) or two-tailed distribution based on the hypothesis.
- Left tailed test- H0:median≥ Hypothesized value k; H1: median <k
- Right tailed test- H0:median≤ Hypothesized value k; H1: median >k
- Two-tailed test- H0: median= Hypothesized value k; H1: median ≠k
Assumptions of the one sample sign test
- Data is non-normally distributed.
- A random sample of independent measurements for a population with an unknown median
- The variable of interest is continuous
- 1 sample test handles a non-symmetric data set, which means skewed either to the right or the left.
Procedure to execute One Sample Sign Non Parametric Hypothesis Test
- State the claim of the test and determine the null hypothesis and alternative hypothesis
- Determine the level of significance
- Assign positive and negative signs to the sample data, and determine the sample size (n)- n is the sum of positive and negative signs
- Find critical value
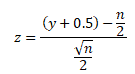
- Compute the test statistic-
- If n≤ 25 (approx), use y. Where y is the smaller number of positive and negative signs
- For a larger sample size, if n > 25, use
- Make a decision, the null hypothesis will be rejected if the test statistic is less than or equal to the critical value
- Interpret the decision in the context of the original claim.
Example of One Sample Sign Test
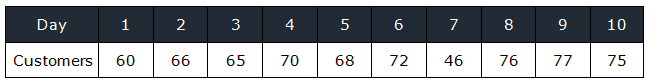
A Bank of America West Palm Beach, FL branch manager shows that the median number of savings account customers per day is 64. A clerk from the same branch claims that it was more than 64. The clerk found the number of savings accounts customers per day data for 10 random days. Can we reject the branch manager’s claim at a 0.05 significance level?
- Null Hypothesis H0: Savings account customer median = 64;
- Alternative Hypothesis H1: Savings account customer median >64
Assign observations less than 64 with a – sign and observations above 64 with a + sign
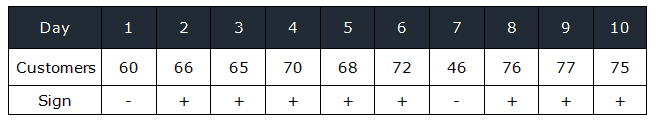
Total number of + values =8
Total number of – values =2
Test statistic is a minimum of (8,2) =2
Look at the Binomial table (10, 0.5)
- Note: 10- is the number of trails
- 0.5 – 50% chance more than the median value and 50% change less than the median value
At 0.05 significance level
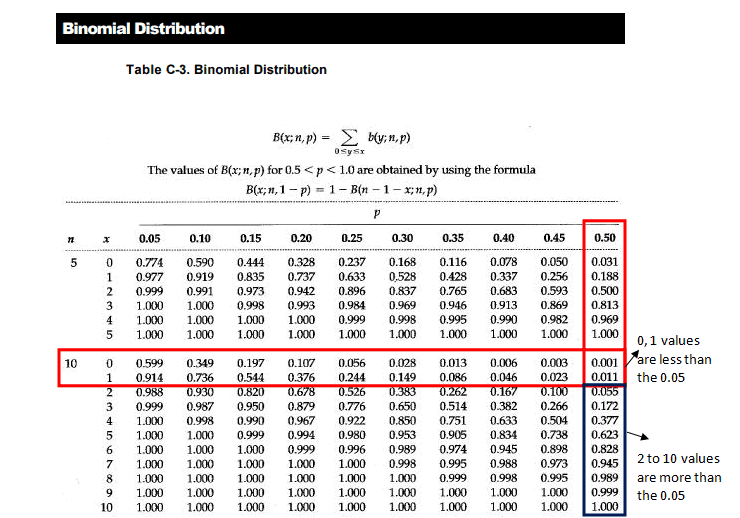
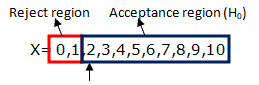
The probability for x=2 is 0.055, which is greater than 0.05. Since test statistic 2 is in the acceptance region ( H0), hence failed to reject the null hypothesis. So, there is no significant evidence that the number of savings account customers per day is more than 64.
Six Sigma Black Belt Certification 1 Sample Sign Non Parametric Hypothesis Test Questions:
Answer A: The sign test uses the binomial distribution to determine whether a statistically significant difference exists between the median of a non-normally distributed continuous data set and a standard.

Comments (10)
Ted, I am having a hard time understanding the binomial chart. It just seems intuitively (given that 8 readings were above 64, that the null would be rejected? Can you help me figure out how to read that chart? thank you.
Example of One Sample Sign Test
Bank of America West Palm Beach, FL branch manager indicates that the median number of savings account customers per day is 64. A clerk from the same branch claims that it was more than 64. Clerk collected the number of savings account customers per day data for 10 random days. Can we reject the branch manager’s claim at 0.05 significance level?
Null Hypothesis H0: Savings account customer median = 64;
Alternative Hypothesis H1: Savings account customer median >64
Assign observations less than 64 with – sign and observations above 64 with + sign
Total number of + values =8
Total number of – values =2
Test statistic is minimum of (8,2) =2
Look at at the Binomial table (10, 0.5)
Note: 10- is the number of trails
0.5 – 50% chance more than the median value and 50% change less than the median value
At 0.05 significance level
1 Sample Sign Non Parametric Hypothesis Test
Since test statistic 2 is in accept region ( H0), hence accept the null hypothesis. So, there is no significance evidence that the savings account customers per day are more than 64.
Hello Barabara,
If you see the above binomial chart for x=0 the probability value is 0.001 and x=1 the probability value is 0.011, from X>2 all the probabilities are greater than 0.05. If our critical value is 0 or 1 then it would have been in the rejection region of H0, but the critical value is 2 and the probability value is 0.055 which is greater than 0.05. Hence it is in the acceptance region of H0.
Thanks
Please, could you tell me, How to calculate the value of Probability value .055 where x=2?
Dipjoy – are you referring to Binomial probability? If so, please see the article here.
I think you are reading the question backwards? You have greater than 2 values above the critical level, therefore you SHOULD fail to reject the Null hypothesis.
I have run these numbers with your 50% false rejection rate in my computer software and got a reject null hypothesis result.
Hello Emily Higgins,
I run it in the Minitab software and the result is
—————————————
Sign Test for Median: C1
Sign test of median = 64.00 versus > 64.00
N Below Equal Above P Median
C1 10 2 0 8 0.0547 69.00
p value greater than 0.05
Thanks
hello..
can the one sample sign test also test the null hypothesis that the mean of a distribution is equal to some hypothesized value k?
or only the median?
Thanks
Hi Mita,
The one sample sign test computes the statistical significance of a hypothesized median value for a single data set.
H0: Median= Hypothesized value k;.
H1: Median ≠k.
The sign test is considered a weaker test, because it tests the pair value below or above the median and it does not measure the pair difference.
Thanks
The Binomial Distribution table in my ASQ Black Belt handbook, 4th addition is different than the binomial distribution you show in the example. I also did some searching, and could not find the distribution table you show in the example (see for example: https://www.dummies.com/article/academics-the-arts/math/statistics/figuring-binomial-probabilities-using-the-binomial-table-147222/)
The Binomial table (10, 0.5), x=2 shows p=0.044 and thus would be in the acceptance region.
Hello Edward Kind-Kovach,
The binomial distribution table, which is used as an example and other websites (see a few examples here), has the same values for n=10 across all sites.
https://www.statisticshowto.com/tables/binomial-distribution-table/
https://www.sjsu.edu/people/saul.cohn/courses/stats/s0/BinomialProbabTable.pdf
Thanks