A tree diagram is an analytical and planning tool used to break down problems progressively into greater detail by partitioning bigger problems into smaller ones. It is also called a hierarchy diagram, systematic diagram, and analytical tree. It is one of the seven management tools. These tools are used for planning and managing operations effectively. The basic purpose of the 7M tools is to guide managers in planning, analysis, and decision-making.
A tree diagram helps you break down big concepts into progressively greater detail. The idea here is to systematically break down a concept into its constituent pieces.
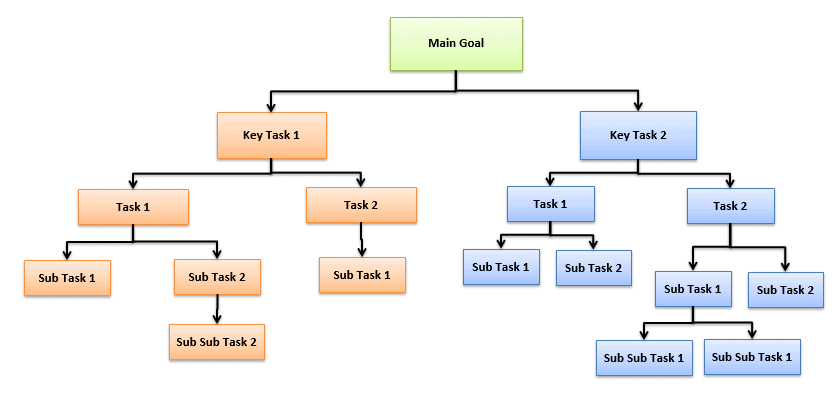
The tree diagram starts with one item that branches into two or more. The branch further split into two or more, and so on. It looks like a tree with a trunk and multiple branches.
Why Use a Tree Diagram
The objective of the tree diagram is to partition a big idea or problem into finer levels of detail. Doing this will make the idea easier to understand or the problem easier to solve. Developing the tree diagram helps you think step by step from general to specific.
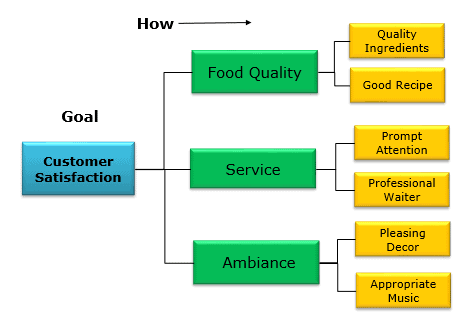
You would progress from left to right with the highest order items / most essential concepts on the left. You would start with the “whys” and progress to the “hows.” Alternately, you would start with the “goals” and progress to the “means” of achieving those goals. Furthermore, it is one of the analytical tools for quality improvement programs.
Tree diagrams are helpful tools outlining details related to a problem, idea, process, or plan.
When to Use Tree Diagram
The Six Sigma team uses a tree diagram to analyze the process in detail. It helps to develop a systematic step-by-step strategy to achieve the goal. It is one of the root cause analysis techniques like the 5Why, which is used to identify root causes in a step-by-step method. However, the 5Why handles only one cause at a time, but the tree diagram can narrow down and address multiple possible causes in a diagram.
The purpose of the tree diagram is to explore the ways and means to achieve the project objective. Develop a list of alternative means and ways to present them in a visually understandable form.
An Interrelationship diagram helps you see relations and influences between several concepts. Similarly, the Affinity diagram gathers all ideas from the team brainstorming session and groups them based on their natural relationship. These tools help to present the data in a useful way, but taking action or implementing solutions requires further analysis. Hence, the Six Sigma team uses a tree diagram after other analytical tools uncover the issues.
How to create a Tree Diagram
- Determine the goal statement of the project or problem. Place the goal on the top or left side of the diagram based on a vertical tree or horizontal tree.
- Identify key tasks and subtasks to be accomplished to achieve the project goal.
- Brainstorm all possible answers for each task and subtask. The diagram is to progress from generic to more specific.
- Verify all the items and identify any additional tasks that must be included in the tree to achieve the goal.
- Continue the exercise till you reach the fundamental elements. In other words, continue until all possible options are exhausted.
Advantages
- Visualization is a simple and easy way to construct a diagram.
- It is easy to understand the dependencies.
- It is comprehensive- represents the outcomes, and traces up to the project’s goal.
- Great flexibility–easy to use in any field to assist management.
Disadvantages
- Though it is easy to construct, often confusing with whole diagram visualization of information.
- Cumbersome with various branches after a certain limit.
- Difficult to add new branches in the middle, as it needs to move the total structure to the lower levels of the tree.
“If you choose not to decide, you still have made a choice.”
Tree diagrams benefit from affinity diagrams.
An affinity diagram is one of the planning tools used to gather all ideas from the team brainstorming session. The diagram groups them based on their natural relationship. It only helps to present useful ideas, but taking action or implementing solutions requires further analysis. In contrast, the tree diagram progressively breaks down problems by partitioning bigger problems into smaller ones. A tree diagram is a systematic diagram; it visually depicts the tasks and subtasks to be accomplished to achieve the project goal.
Tree Diagram Videos
Six Sigma Black Belt Certification Tree Diagram Questions:
Question: After the major headings of a tree diagram have been broken into greater detail, what next step should be taken? (Taken from ASQ sample Black Belt exam.)
(A) Assemble the right team.
(B) Review the diagram for logical flow and completeness.
(C) Revise the problem statement.
(D) Choose the tree diagram goal statement.
Answer:
D: Reveal the true level of a problem’s complexity. We can eliminate A easily as there is no way to identify root causes without credible data or process information. Similarly, a tree diagram graphically displays increasingly complex layers of a problem, not to show causality. Data from a check sheet is in a dot plot or other means but not on a tree diagram.
