What is a Box and Whisker Plot?
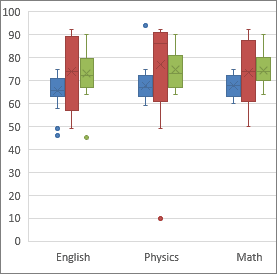
Box plots are graphical tools that let you easily visually compare variations between the data sets evaluated. It also makes comparisons quickly and easily. In other words, Box plots are used in statistics to graphically display various parameters at a glance.
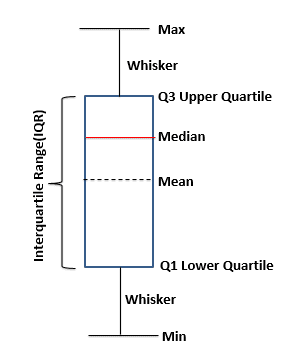
Graphical analysis is one of the best ways to analyze the problems in Six Sigma projects. It is an effective way to visualize data patterns and provides key insights into the data. Different graphical tools, such as Run charts, Scatter diagrams, Histograms, and Pareto Chart depict different data features such as trend, frequency, dispersion, and shape of the distribution. Box plot, a.k.a Box and Whisker plot, is a pictorial representation of continuous data. Box plots show the max, min, median, interquartile range Q1, Q3, and outlier.
Rectangles are drawn to show the second and the third quartiles. And there is a vertical line that shows the median value. Both the upper and the lower quartiles are displayed as horizontal lines on both sides of the rectangle. It has the name box and whisker because the lines extend vertically from the boxes. These lines indicated the variability outside the upper quartiles and lower quartiles.
- Median.
- Maximum.
- Minimum
- First quartile (0-25%)
- Third quartile (75%)
Why Box Plots
Box plots are very effective and easy to read. Graphically it shows the variation between multiple variables and the variations within the ranges.
It is also called a box-and-whisker plot or “five number summary.” In other words, quartiles, the median, and the highest and lowest values. It shows how the data scattered within those ranges will help for effective decision-making.
When to use Box plot?
- Box plots compare multiple data sets from independent sources that may have some relationship.
- To compare the process changes before and after the improvements
- Box plots help to display various parameters at a glance.
- To read the median, interquartile range, and outliers in the data set
- When the data is in metric scale levels such as age, temperature, etc.
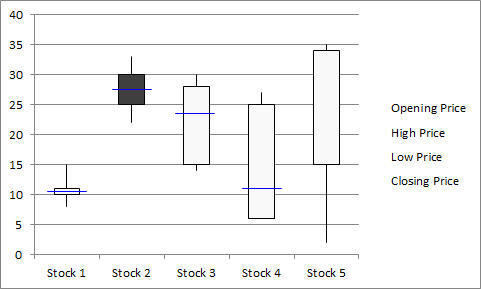
What Can Box Plots Tell Us?
- Middle values: The box indicates the range in which the middle 50% of all data lies
- Median: The blue horizontal line indicates the median of the group.
- 1st Quartile and 3rd Quartile: The lower end of the box is the 1st quartile, and the upper end is the 3rd quartile.
- Useful in visualizing most of the spread of variation.
- Ex. Stock 1 typically has the least variation.
- Skewness: By looking at a box plot you can tell if your data distribution is skewed if the line inside the box is not centered.
- Ex. Stock 4’s median is not centered. Thus this data is skewed.
- Extreme values: The vertical lines (whiskers) show max and min values.
- Ex. Stock 5 tends towards larger values.
- The data which is not in between whiskers are to be plotted as outliers with dots, small circles, or stars.
- Some of the box plots also make use of an additional character to represent the mean of the sample data.
- Some of the box and whisker plots make use of a cross-hatch that is placed on the whiskers. All the box plots will definitely have whiskers.
How to Make a Box and Whisker Plot?
Now, coming to the creation of box and whisker plots, you will need to follow the points given below:
- Gather the data: Get the data for which you need to create plots.
- Organize this data: Order the data by sorting them numerically, in ascending or increasing order.
- Calculate Medians: Find out the Median of this data range. This Median will divide the data into halves. And to find out the quartiles, compute the Medians of the 2 halves. If the data set has an odd set of numbers, the Median would have an equal amount of numbers on both sides. And, if the data set has an even set of numbers, the 2 numbers in the middle would have to be added up and averaged.
- Calculate 1st and 3rd quartiles: This can be found out by finding out the Median of each of the halves.
- Draw plot lines: Now, you will need to draw plot lines and mark the Median and quartiles.
Box Plot Example
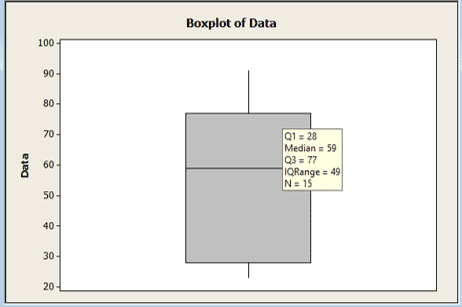
Example: Draw a Box plot for the following 15 points
23,28,44,72,66,54,89,91,26,24,59,74,81,36,77
Step 1: Organize the data: Arrange the data in ascending order
23,24,26,28,36,44,54,59,66,72,74,77,81,89,91
Step 2: Calculate median: 23,24,26,28,36,44,54,59,66,72,74,77,81,89,91
59 is the median value
Step 3: Find 1st Quartile: find the median of the lowest half of the data set
23,24,26,28,36,44,54
28 is the median value
Step 4: Find the 3rd Quartile: find the median of the upper half of the data set
66,72,74,77,81,89,91
77 is the median value
Step 5: Draw a 5-number summary: Draw plot lines and mark the Lowest, Highest points, Median, and quartiles.
Uses of Box and Whisker Plot
There are various uses for this plot. Given below are some of the main features and advantages:
- Easy to use: It is a convenient way to depict the numerical data groups in a graphical manner, especially with the help of quartiles.
- No Assumptions: These display the variations in samples without making any kind of assumptions on the statistical distributions.
- Skewness and dispersion: The box plats are not parametric. The spacing between various parts of the box shows the scenes and dispersion in the data.
- Various statistical values: Other than the points, these plots also help estimate range, mid-range, mid-hinge, inter-quartile ranges, standard deviations, and tri-mean. These plots help to find the Median, Maximum, Minimum, 1st Quartile (25%), 3rd Quartile (75%). So, one can easily find out even the 2nd, 9th, 25th, 50th, 75th, 98th, and 99th percentile, along with the Median.
- Uniformity: These plots are quite uniform. The box’s top and bottom are the first and third quartiles. The bands inside the box are the second quartile or the Median.
- Easier comparisons: It also makes the comparisons between the data sets easier and quicker.
- Equal spacing: If there is a normal distribution of data, all the marks on the plot will be equally spaced.
How to Make Box and Whisker Plots in Excel?
The emergence of Excel has made life easier for all analysts and statisticians. It is so much easier to present data in various forms on Excel. There are pivot tables, bar graphs, and box and whisker plots, which help represent the data in a more understandable format. This article will give you detailed information about how to make a box and whisker plot. But, before we start with that, we need to understand the basic question – “What is a box and whisker plot?” and how does that help us?
Given below are the steps for making these plots in Excel:
- Type the sample data in the worksheet.
- Select the cells that have data. Now, click on Chart on the Insert menu.
- On the tab, Standard types, click on Stock under the Chart Type. Then, click on the fourth chart from there.
- Now, click on the Next tab and click on Data Series in Rows under Data Range.
- Then on the tab Legend, uncheck the Show Legend check box.
- On the tab Axes, uncheck the Value (Y) Axis under the Secondary Axis and then click on Finish.
This way, you would have created your box and whisker plots. Hope you have learned how to make box and whisker plots and could do them on your own.

Comments (2)
Can you include a visual example of a box plot within this article? The min, max, median, skewness, and quartiles definitions can refer to the visual as an example reference.
You got it Dion. Added 2. I’ll update with specific call outs to the definitions soon. Thanks for the alert!