A Balanced Scorecard (BSC) is a framework for managing business strategy. It maps strategic choices to aspects of your business.
The four strategic choices:
- Objectives: High-level, long-term goals.
- Measures: Metrics that help you check your progress toward your objectives.
- Initiatives: Key large-scale actions that you’re taking to meet your objectives.
- Action items: Small-scale actions that you’re taking to support your initiatives.
It covers four aspects of your business:
- Financial: Your income and outflow. Decreasing costs, increasing income, and opening new sources of revenue.
- Customer: How do your customers relate to you? Satisfaction levels, market share, brand awareness, and brand sentiment.
- Internal Processes: streamlining processes, improving production quality, boosting efficiency.
- Learning and Growth: employee skills, knowledge transfer, intellectual property, company culture.
It’s called a Balanced Scorecard because it helps you balance your strategy across all business areas. This is a key component for creating successful growth in a company.
Sample Balanced Scorecards
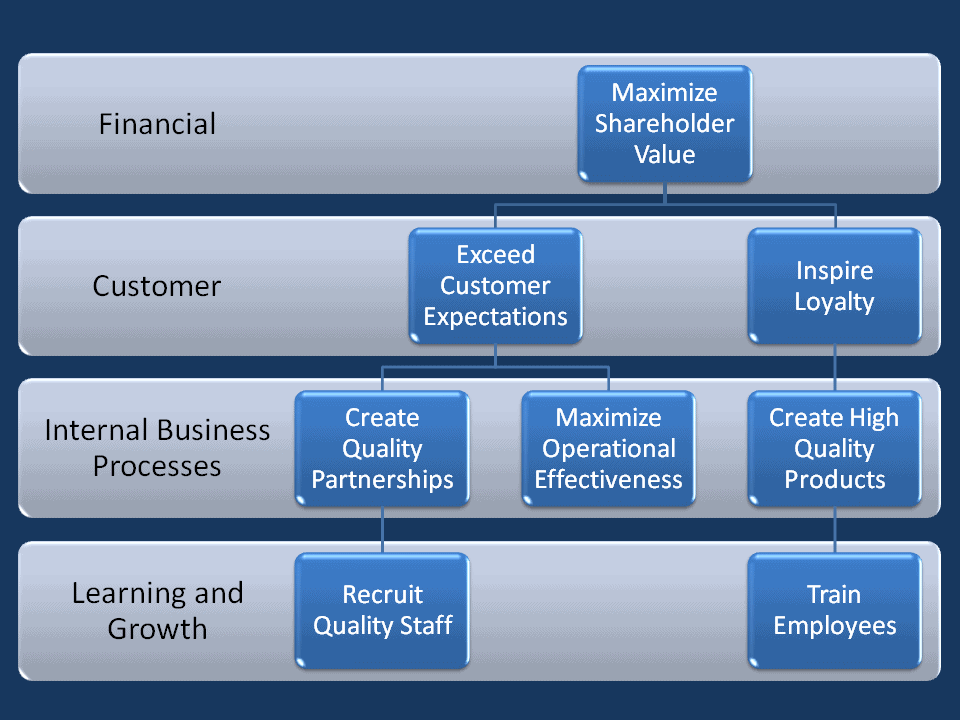
In the example above, objectives are mapped across the four aspects of the business. You can see at a glance which aspect every objective relates to. You can also see how each objective connects to the others.
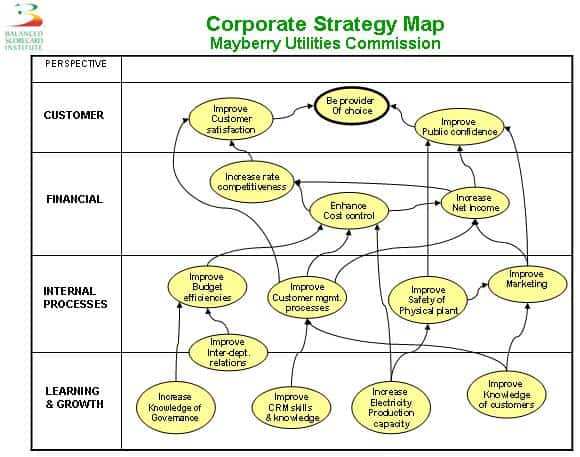
The sample above has a few differences from the first. Firstly, the business aspects are in a different order. This business has different priorities. Secondly, it has more goals. Thirdly, not all goals are clearly located in a single aspect. These are important points: create your scorecard to suit your business.
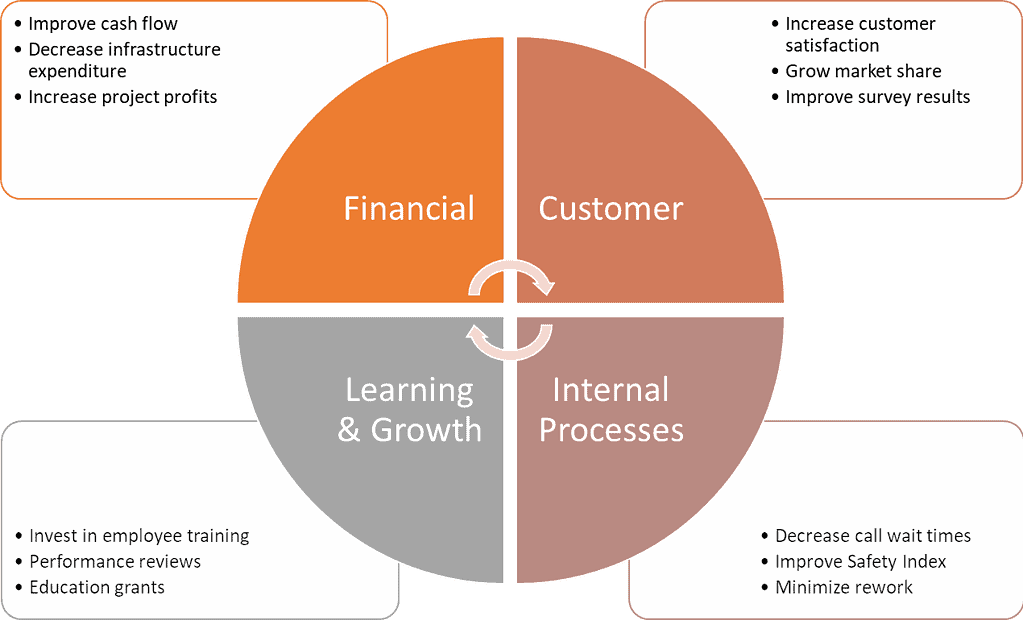
While most balanced scorecards will use rows, you’ll find some in other formats. The scorecard above is an example of the cycle format.
When to use a Balanced Scorecard
Use a balanced scorecard when:
- You’re developing a strategy for an entire business.
- You need a big-picture approach.
- You want to address all aspects of your business.
How to create a Balanced Scorecard
There are a few steps to create a balanced scorecard for your business.
Identify the aspects of your business.
Firstly, decide which aspects of your business are key to its success. Most will use variants of the four used above:
- Financial
- Customer
- Internal processes
- Learning and growth
However, you might have other areas that you prioritize. For example, a fintech company might have a ‘Technology’ aspect. Or a startup might include ‘Innovation.’
Decide your priority order.
Your priorities might be in a different order from the standard. You might value learning and growth because employee well-being is a cornerstone of the business. Customer satisfaction might be your primary goal.
Your aspects could look like this instead:
- Customer
- Technology
- Learning and growth
- Financial
- Internal processes.
Choose your goals
You need some business objectives. Thinking through these questions can help:
- Where do you want your business to be in five years?
- How does your business need to improve?
- What are the main flaws that you could fix?
- Where are the opportunities in the market?
- Does the company culture work well?
What will you include?
Many balanced scorecards display objectives. However, you might also want to include your measures, initiatives, and action items. This gives you a more detailed overview.
Map your strategy
The next step is to map your strategy to your business aspects. There are a few different tools that you can use:
- Microsoft Word offers a ‘Labeled Hierarchy’ SmartArt object. You can easily construct a BSC with this.
- LibreOffice Draw contains all the graphical features you need to create a BSC. Manual effort is required, though.
- Online tools like Canva and LucidChart offer BSC templates.
Is it balanced?
Your final step is to evaluate your scorecard. Is it balanced? Or are all your strategic choices bunched into one or two aspects of your business? If your scorecard isn’t balanced, revisit your goals.
KPIs and KPOVs
Key process input variables (KPIVs) may be analyzed to determine the degree of their effect on the process output variables. It is also known as KPOVs. Hence, KPIV is the prime factor determining the key process output variable (KPOV) or product quality. We use key performance indicators (KPIs) and key process output variables as metrics to tell us how we’re doing.
Use KPIs and KPOVs with the balanced scorecard concept to create a balanced dashboard or KPI/KPOV scorecard. This provides a running update on progress towards your goals.
What to do with a Balanced Dashboard
It’s all very well to create a balanced dashboard. But what now?
Once you’ve plotted your progress toward your goals on your dashboard, the next step is to analyze. Are there aspects of your business in which you’re crushing your goals? Are there aspects in which you’re really, really not?
Example Balanced Dashboard
A call center created a balanced scorecard three months ago. The call center was having trouble with:
- Calls are taking too long.
- Customers are waiting too long in the queue.
- Customers were unhappy with how much time they had to spend on the line with customer service.
- Expenses are too high.
So, the company’s balanced scorecard for the next six months looked like this:
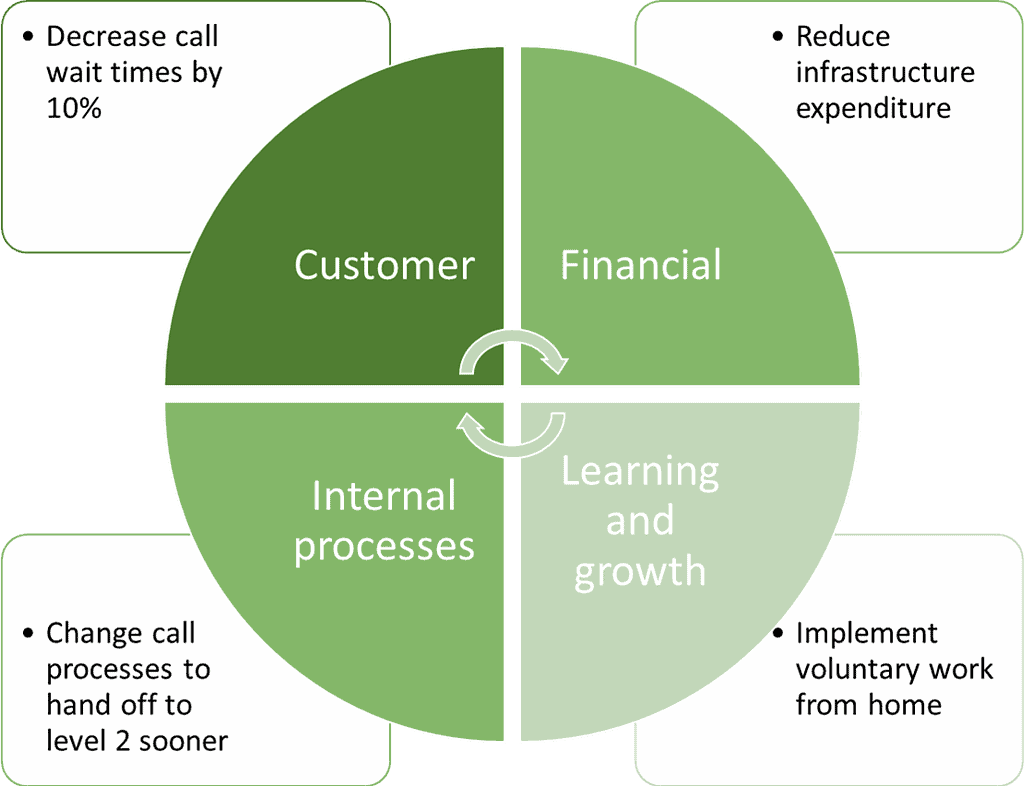
The company must look at its progress toward these goals three months later.
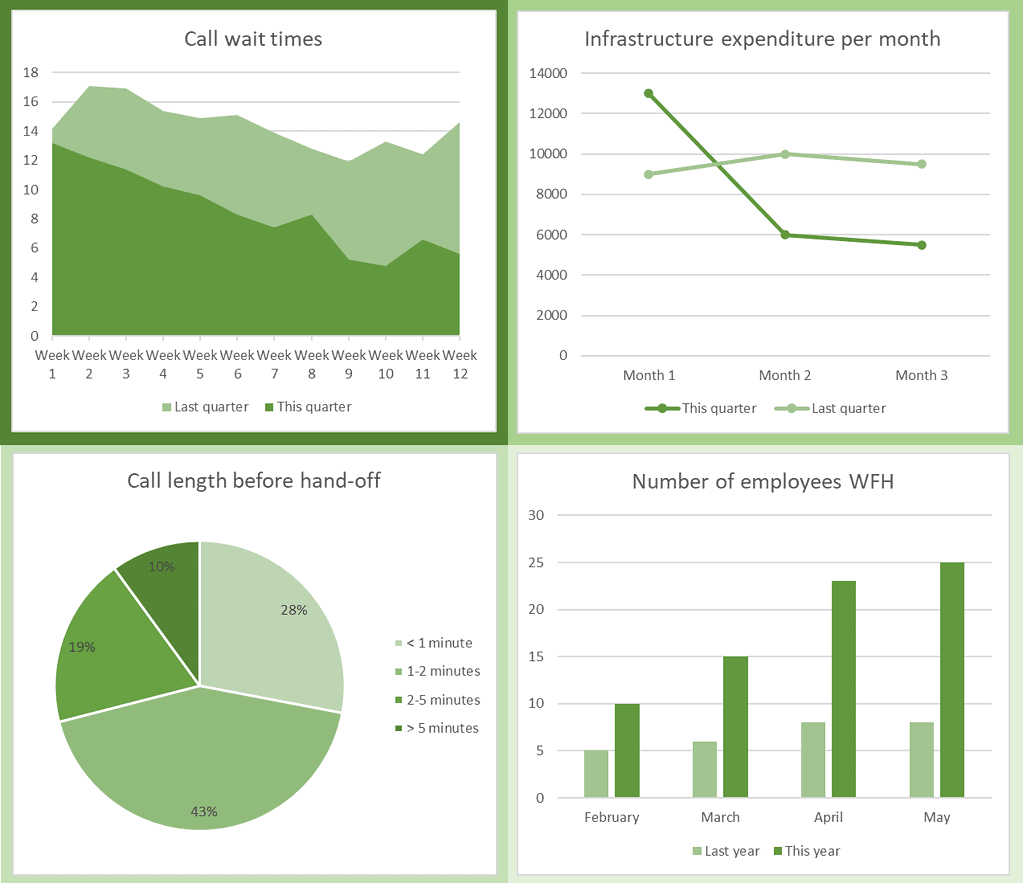
It needs a balanced dashboard to track its numbers in each quadrant.
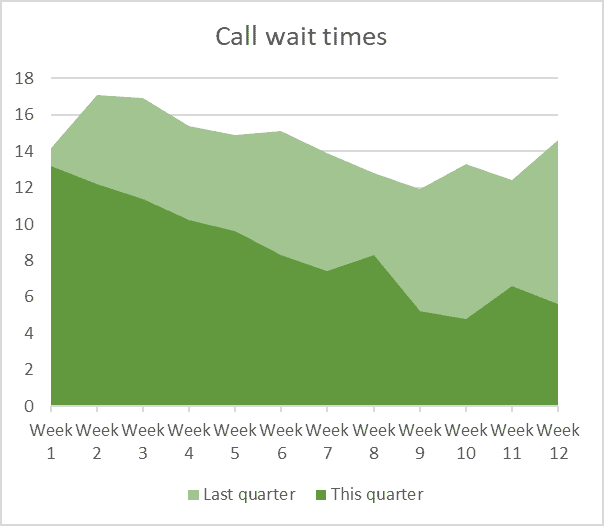
The team responsible charts each week’s average call wait times in the current and preceding quarters.
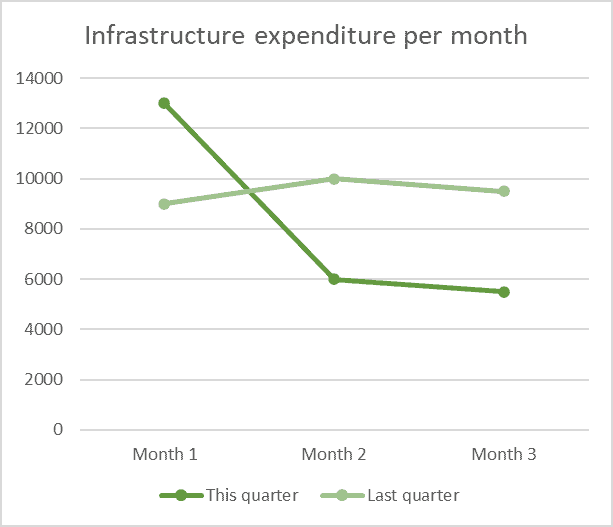
It charts its monthly infrastructure expenditure for the current and preceding quarters.
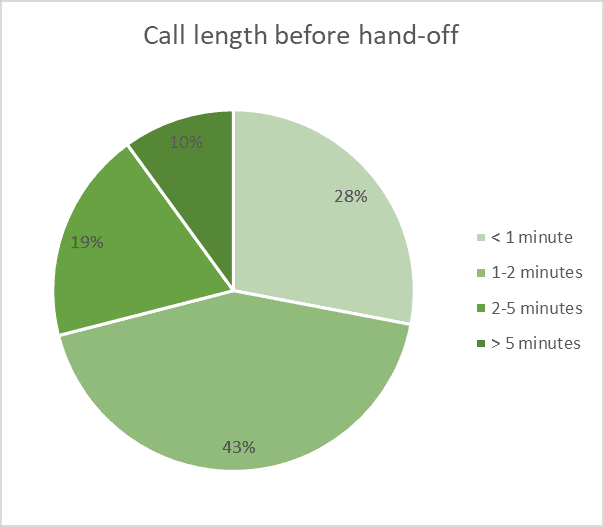
The team charts the percentage of calls lasting a certain amount of time before being escalated to level 2 support.
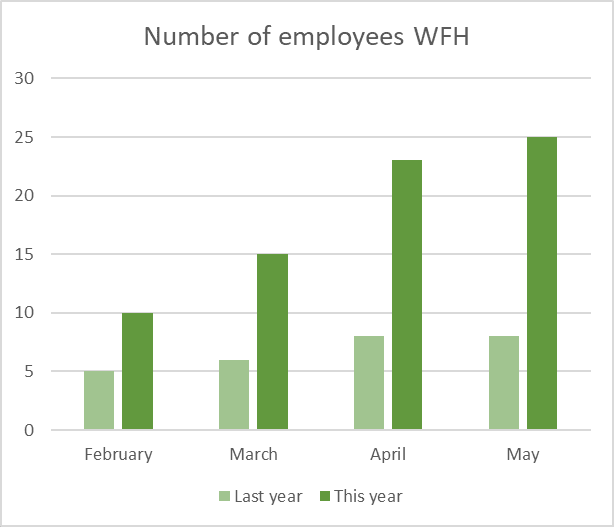
Next, the team charts the number of employees working from home.
Finally, it combines all of these into a balanced dashboard so that all staff can see their progress toward goals at a glance.
Points to keep in mind for Balanced Scorecards
Here are some things to remember when you’re creating balanced scorecards and dashboards:
- If you don’t decide on metrics up front, you won’t be able to measure your progress.
- It’s probably not a good metric if you can’t chart it. Metrics are objective and measurable.
- Don’t make your short-term goals so big that your staff won’t be able to meet them. Smashing small goals builds morale.
- Balancing your goals across your business is good. Creating spurious goals to achieve ‘balance’ is pointless. If you can’t develop goals that are important in a particular category, ask yourself: “Is this aspect of the business important? Can I replace it with something else?”
- Support your goals with action items. It’s not enough to figure out where you want to go; you must also work out how to get there.
When you’re ready, there are a few ways I can help:
First, join 30,000+ other Six Sigma professionals by subscribing to my email newsletter. A short read every Monday to start your work week off correctly. Always free.
—
If you’re looking to pass your Six Sigma Green Belt or Black Belt exams, I’d recommend starting with my affordable study guide:
1)→ 🟢Pass Your Six Sigma Green Belt
2)→ ⚫Pass Your Six Sigma Black Belt
You’ve spent so much effort learning Lean Six Sigma. Why leave passing your certification exam up to chance? This comprehensive study guide offers 1,000+ exam-like questions for Green Belts (2,000+ for Black Belts) with full answer walkthroughs, access to instructors, detailed study material, and more.


Comments (2)
Under which phase do balance scorecards fall?
Hi Jeremy,
Good question. There are a few answers here.
You could be using a Dashboard as part of chartering a project in the Define phase. Alternatively, you could be updating or editing Dashboards as a result of your project when checking results in the Improve phase or even as part of a control plan in the Control Phase.
Best, Ted