Taguchi Robust Design and Loss function were proposed by Genichi Taguchi. In the United States, his concepts related to robustness for evaluating and improving the product development process were referred to as “Taguchi Methods”. Taguchi named his concept “Quality Engineering,” whereas other authors referred to it as “Robust design” or “Robust engineering”.

Taguchi Robust Design Approach
Robust design has been the key development in the design process in recent years. The Robust approach in design is a key aspect as it produces reliable design both during manufacturing and also during product use. The basic concept of robust design is that parameter control that makes the design strong enough that it does not cause failure due to random “noise.”
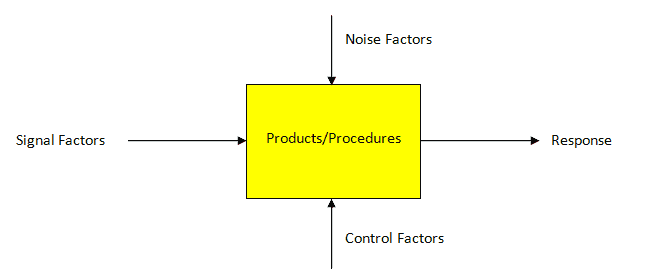
The Taguchi robustness approach says that processes or products are controlled by various factors to get the desired response.
- Signal factors: Signal factors are the signals that get the desired response. Ex: pressure valve set to get the required air pressure in the line
- Control factors: These factors produce the response based on noise in the process, and also these are controlled by the designer. For example, heat shrinks or thermocouples will respond based on the heat generation in the process. Sometimes these factors add costs to the design; hence these are also called tolerance factors.
- Noise factors: These are random events in the process, only mean, and variance can be predicted but are not controllable by the designer. Ex: voltage fluctuation, air pressure variation, etc.
The noise factors impact the response and lead to errors; hence designers focus on appropriate control factors to produce a maximum response to signal factors. Taguchi defined Noise into three categories.
- External Noise: variations in the environment where the product is used
- Deterioration Noise: wear and tear inside the unit
- Internal Noise: deviation from target values
Taguchi Robust Design Principles
He demonstrated robust design from the below three method concept
Concept Design
Concept design is a process of selecting a product or process based on competing technologies, customers, price, or any other important considerations. Moreover, the biggest advantage of this method is that organizations can produce high-quality products with low production costs.
Parameter Design
Parameter design refers to the identification of control factors for the process and also to determine the optimal (target) level of each factor. Initially, in this method, the design is developed using low-cost parts and manufacturing methods. Afterward, the response is optimized to minimize the noise. Furthermore, the ultimate goal of this method is to find an efficient process (functionality robust) and service design.
Steps to perform Parameter Design
- Identify signal factors and noise factors and also respective ranges
- Select as many as possible control factors and also levels of the factors, and then dispense these levels to suitable orthogonal arrays ( to identify the main effect with a minimal number of runs). Functionality can be improved by adjusting different levels of control factors.
- Determine the S/N ratio
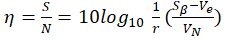
- Where
- r is the measurement of the magnitude of the input signal
- Sβ sum of squares of ideal function
- Ve mean square of nonlinearity
- VN error term of linearity and nonlinearity
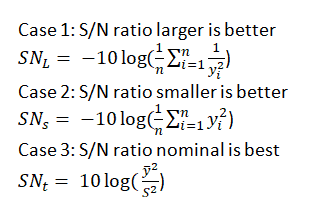
Signal to noise (S/N) ratio is especially used to calculate the performance of the system. Interestingly the ratio of S/N depends on the situation, sometime Nominal S/N ratio is the best, for instance, target. Sometimes larger S/N ratio is better. Ex: performance and in a few instances smaller S/N ratio is better. Ex: variation.
- Identify the optimal conditions from the experimental data for this maximum S/N ratio to be used for each level of control factor.
- Finally, perform real production runs.
Experimental design using standard orthogonal array
Design of experiment is an experimental strategy in which the effect of multiple factors is studied simultaneously by running tests at various levels of factors. Usually, in experiments some have few factors, some have too many factors, while there are others that have mixed levels.
The total number of experiments required for 2 levels can be calculated below.
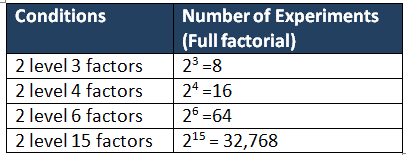
Full factorial always needs more experiments. However, in the majority of experiments, all factors possess the same number of levels. In the Taguchi approach, a fixed number of orthogonal arrays are used to handle common experimental situations.
Particularly the Design means determining the number of experiments to be performed and the manner in which they should be carried out (i.e., a number of factors and levels). Taguchi has constructed a number of orthogonal arrays to accomplish experiment design. Moreover, each array can be used to suit a number of experimental situations.
Example: L4 (23) orthogonal array
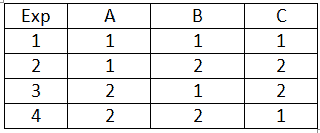
Standard notation for orthogonal arrays Ln (lm)
- n- number of experiments
- l- number of levels
- m- number of factors
- Rows represent the experimental conditions
- Columns represent the factors
- Each array can be used for many experimental situations
Orthogonal arrays have the property that every factor setting occurs the same number of times in every test set of all the other factors. This allows for making a balanced comparison among factor levels under various conditions.
Example of Using Taguchi’s orthogonal array design in DMAIC
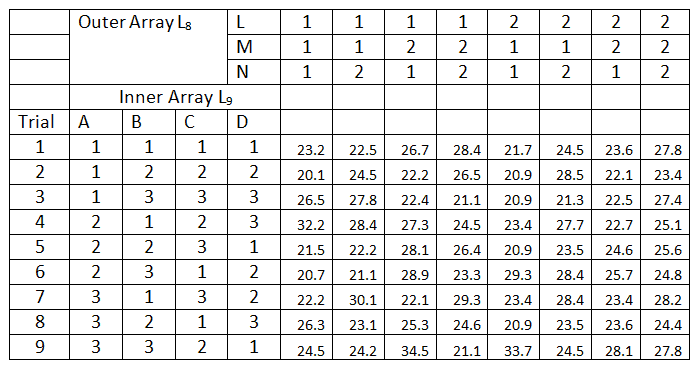
In XYZ plastic industry, plastic extrusion was used in which raw plastic is melted and formed into a continuous profile. The aim of experiments is to improve the component strength (N/m2). Identified 4 control factors (A, B, C, and D) of 3 levels (Low, medium, and high ) and 3 noise factors (L, M, and N) of 2 levels (Low and High)
Since 4 control factors of 3 levesl, L9 orthogonal method was used for control factors, and 3 noise factors of 2 levels, L8 orthogonal method was used for noise factors. Here are the experimental results.

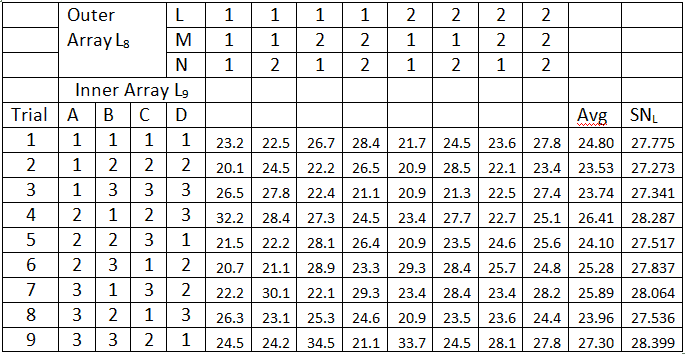
Plot factor contributions and select parameter levels that maximize S/N ratio
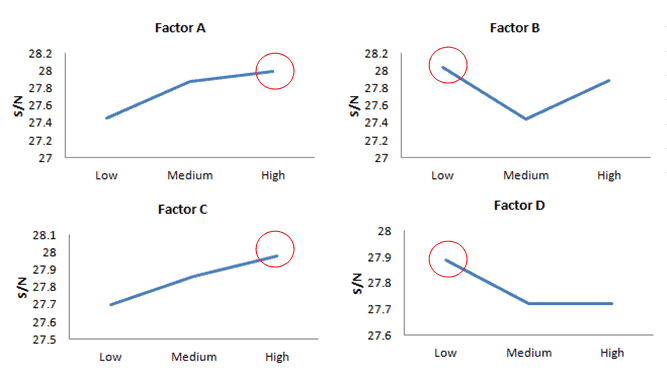
From the above graph, the maximum S/N ratio for A at a high level, B at a low level, C at a high level, and D at a low level
The robust design is attained, which will maximize the response (strength) under the influence of noise factors when
- A factor set at high level
- B factor set at low level
- C factor set at high level
- D factor set at low level
An ANOVA can also be used apart from the S/N ratio, but Taguchi prefers the graphical technique to visualize the significant factors. Moreover, the advantage of the Taguchi design method is determining the optimum combination of factors and levels for the analysis. Finally, confirmation productions run to be carried out to check the results.
Additional Helpful Robust Design Resources
Tolerance Design
Tolerance is an acceptable limit of deviation in a parameter’s dimension or value, and this must be determined for all system components. In other words, Tolerance design maintains the balance between quality and design cost. Thus, Tolerance design creates metrics allowing designers to compute the tolerances that can be adjusted to meet customer needs and expectations while delivering a cost-effective product.
Tolerance design is a step beyond parameter design as it impacts the budget, such as material change, equipment, etc. Apart from economics, it also considers other important factors like constraints due to safety factors, material property, design choice, etc.
The relationship between tolerance specification, the functional limit, and the safety factor are
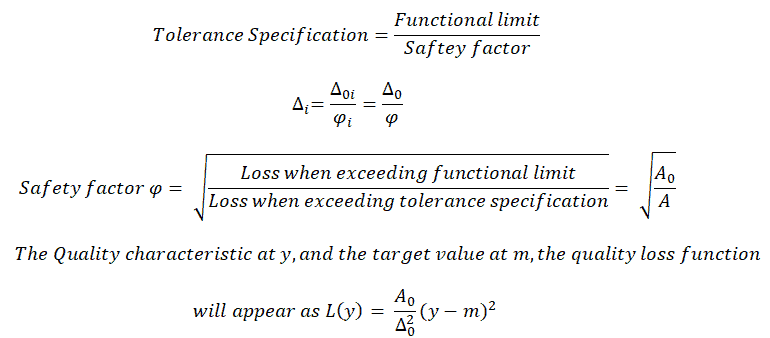
Statistical Tolerance
Statistical tolerance is the method to determine the tolerance when two or more components are assembled. Statistical tolerance indicates the amount of process variance. This is the relationship between independent cause variance and the variance of the overall result.
Statistical tolerance uses the square root of the sum of variances to determine the tolerance required.
Example: Find the overall thickness of the stack consisting of 4 plates of various thicknesses and variation.
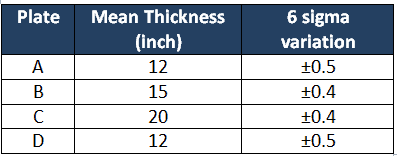
- Nominal thickness = 12+15+20+12=59
- First plate 6σ1 = 0.5; σ1 = 0.083
- Second plate 6σ2 = 0.4; σ2 = 0.068
- Third plate 6σ3 = 0.4; σ3 = 0.068
- Fourth plate 6σ4 = 0.5; σ4 = 0.083
Assuming that the measured dimensions (thickness) of a plate fall within a bell curve and also assuming the standard deviation 3σ is necessary for assembly.
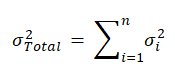
σTotal 2 = σ12+ σ22+ σ32+σ42
σTotal =√(0.0832+0.0682+0.0682+0.0832) =0.151
3σTotal = 0.452
Hence the total thickness of the stack = 59±0.452
Taguchi’s Quality Imperatives
- The basic quality losses are due to poor design.
- For any new products, plan experiments to get the parameter targets.
- Consider customer environment conditions to develop robust products.
- Robustness is a function of product design.
- Quality losses are a loss to society.
- Robust products have a strong signal-to-noise ratio.
- Manufacture products that are consistent by reducing variation.
- Tolerances should be set before manufacturing, and also Quality loss function can be measured.
What is Taguchi’s Loss Function
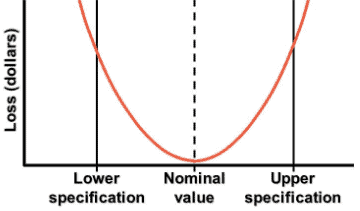
Taguchi loss function was developed by Genichi Taguchi. According to Taguchi every time the process deviates from the target, even if it stays within the specifications, there is a loss to society. In other words, it states that an increase in process variation leads to customer dissatisfaction even if the process is within the specification limit
When would you use Taguchi’s loss function?
Whenever an organization works on process improvements or optimizing the process they especially focus on lowering the variation from the nominal value (i,e target). As a matter of fact, for any business, profit is one of the basic and very important metrics. Thus Taguchi loss function is very valuable and transforms the variation from nominal value with financial depiction. In other words, it gives the relation between lowering the variation from the target to the financial benefit.
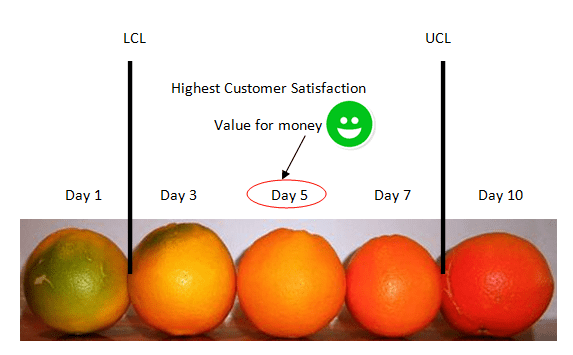
From the above orange example, it is clear that the customer may pay the same amount on day 3, 5, or 7 days, but in reality, on day 5 only, it’s a value for money for the customer, which may further lead to customer dissatisfaction or future business impact. Hence Taguchi Loss function has widely used the organizations.
The loss function is to determine the financial loss that will occur when a quality characteristic x deviates from the nominal value t
The loss function depicted as L(x) = k(x-t)2
- k= loss coefficient = cost of a defective product /(tolerance)2
- t= nominal value
- σ2 = mean value of (x-t)2
Example of Using Taguchi’s loss function in DMAIC
XYZ is a washing machine manufacturing unit that produces various models. For instance, among all the parts compressor is one of the critical parts. What is the loss to society if the voltage is 105V?
- Nominal voltage = 110V
- Mean tolerance = 15V
- Cost of defective washing machine = $5000
k= loss coefficient = cost of a defective product /(tolerance)2 = 5000/(15)2 = $22.2
L(x) = k(x-t)2 = 22.2(105-110)2 = 22.2*25= $555.5
Therefore, if the compressor output voltage is 110V then the loss to the society is zero, whereas if the output of the compressor is 105V, then Quality loss to the society is $555.5
