Sum of Squares (SS) is a statistical method to know the data dispersion and to determine mathematically best fit model in regression analysis. Sum of squares is one of the critical outputs in regression analysis. A large value of sum of squares indicates large variance. In other words, individual values are varying widely from the mean.
The Sum of Squares (SS) technique calculates a measure of the variation in an experiment. Used in Designed experiments and Anova.
Sum of Square formula
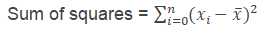
- x̅ is the mean
- xi is the frequency
Types of Sum of Squares
Sum of Squares are widely used in the regression analysis. There are three basic types of sum of squares
- Total sum of squares
- Sum of squares regression
- Sum of squares error
Total sum of squares: TSS represents the total sum of squares. It is the squared values of the dependent variable to the sample mean. In other words, the total sum of squares measures the variation in a sample.
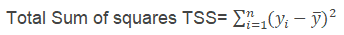
- yi is the one of the value in the sample
- y̅ is the sample mean

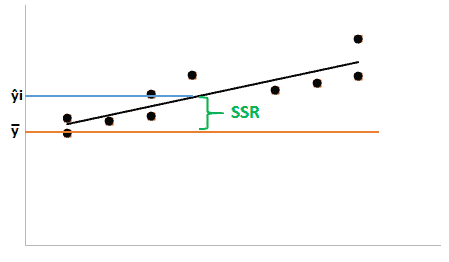
Sum of squares regression: Sum of squares due to regression is represented by SSR. It is the difference between the predicted value and the sample mean.

- ŷi is the predicted value
- y̅ is the sample mean
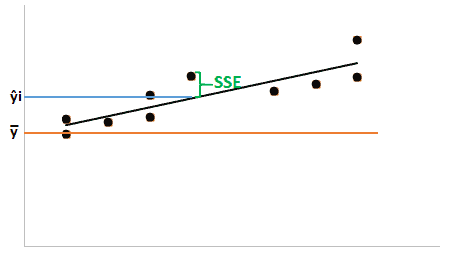
Sum of squares error: SSE represents sum of squares error, also known as residual sum of squares. It is the difference between the observed value and the predicted value.
Usually, the lower the sum of squares error better model the regression. SSE is that part of the total variation which is not modeled by the regression line.
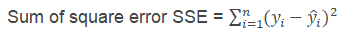
- yi is the one of the value in the sample
- ŷi is the predicted value
The relationship between TSS, SSR and SSE is mathematically represented by
TSS = SSR+SSE
The Sum of Squares is used in ANOVA. ANOVA uses sum of squares between(SSB) group and sum of squares within groups (SSW).
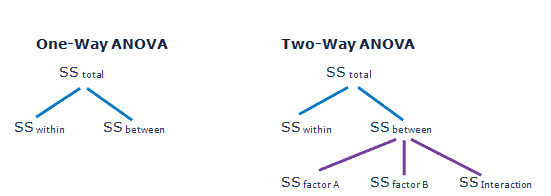
Total sum of squares TSS = SSB+SSW
Uses of Sum of Squares
Sum of squares explains how many individual values are away from the mean, it helps to know the variability in the data. Standard deviation and variance are the two important parameters in statistics, but to compute these values first, we need to calculate the sum of squares.
How to calculate the Sum of Squares
Step 1: List all of the values.
Step 2: Calculate the mean (arithmetic average) of all values. Summing up all the values and divided by number of values.
Step 3: Subtract each value from the mean. If the value is less than the mean, then it produces a negative value.
Step 4: Square of each value, now the result is always positive.
Step 5: Add all the Squared values is the Sum of Squares.
Example Sum of Squares problem.
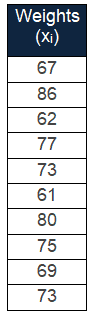
Calculate the sum of squares of 10 students’ weights (in lbs) are 67, 86,62,77,73,61,80,75,69,73.
Step 1: List all of the values.
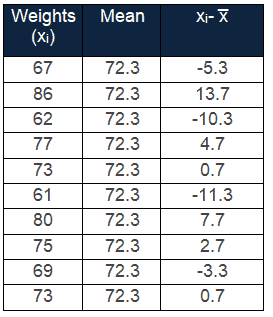
Step 2: Calculate the mean (arithmetic average) of all values. Summing up all the values and divided by number of values.
67+86+62+77+73+61+80+75+69+73/10= 723/10=72.3
Step 3: Subtract each value from the mean. If the value is less than the mean, then it produces a negative value
Step 4: Square of each value, now the result is always positive
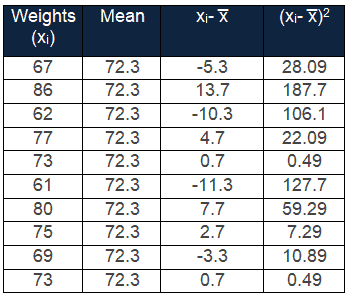
Step 5: Add all the Squared values is the Sum of Squares
Sum of squares = Σ(xi- x̅)2 = 28.09+187.7+106.1+22.09+0.49+127.7+59.29+7.29+10.89+0.49 = 550.1
