A stem-and-leaf plot (or stemplot) organizes numerical data—whether continuous or discrete—by splitting each value into a “stem” (all but the last digit) and a “leaf” (the final digit). It’s a compact way to sort, visualize distribution, and preserve the original data.
Stem and leaf offer a quick and novel way for simultaneously sorting and displaying data sets where each number in the data set is divided into two parts: a stem (all numbers except the last digit) and a leaf (only the last digit). For example, in the numbers 38 and 52, the stems are 3 and 5, while the leaves are 8 and 2.
Significance of Stem and Leaf Plot
Stemplots originated in early 1900s (Arthur Bowley) and were popularized by John Tukey in his 1977 Exploratory Data Analysis. They resemble histograms but retain actual data values, which is useful for visualizing distribution with precision.
Stem and leaf plots are some of the best ways to not only study but track information as well. Stem and leaf plots have been around for decades and are like a cross between a histogram and a check sheet. The difference with this type of graph is that it preserves the actual data as well as being the most like a frequency distribution.
Stem and leaf plots are methods for showing the frequency with which certain classes of values occur. It will organize data visually and will be able to interpret data and draw conclusions using the plot.
Uses
- Effective for organizing and visualizing numeric data.
- Supports quick calculation of median, mode, quartiles.
- Enables direct comparison of multiple datasets with back-to‑back plots.
- Retains original data values, unlike histograms.
How to Create a Stem-and-leaf plot
There are many different ways to create a stem and leaf plot but they all serve the same purpose at the end of the day.
- Sort the data in ascending order.
- Define stems and leaves (stem = all but last digit, leaf = last digit).
- Draw a vertical line and list each unique stem in a left-hand column.
- Map leaves to their stem, sorted ascending.
- Add a key, e.g., “2 | 7 = 27.”
- Compute descriptive stats (median, quartiles, mode) directly from the stemplot.
Example
Example: A teacher asked 23 of her male students how many books they had read in the last 4 years. Draw a stem and left diagram for the following data.
32,55,12,18,23,26,24,28,44,53,27,16,14,34,29,31,41,17,11,32,54,48,45
First, Sort the numerical values in ascending order
11,12,14,16,17,18,23,24,26,27,28,29,31,32,32,34,41,44,45,48,53,54,55
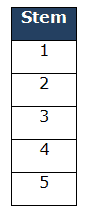
Analyze the data and determine stem and a leaf: The minimum value is 11 and the maximum value is 55.
Draw a line and lists the possible stems in a single column from lowest to highest on the left side of the line.
Then for each stem, record all the leaves associated with that stem. Also, note that leaves are in numerical order.
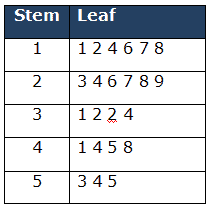
Key: 2|7 means 27 books
Total count values =23
- Median:
- median = (n+1)/2-th value: (23+1)/2 = 12th value in the list
- Mode: The number which appears most often in a set of numbers= 32 number repeated twice. Hence Mode is 32 books.
- Q1 (Lower Quartile) = Find ¼ (n+1) =24/4=6th value is 18 books.
- Q3 (Upper Quartile) = Find ¾(n+1)= 3*24/4= 18th value is 44 books.
- The Quartile range = 44-18 = 26 books.
Back to Back stem-and-leaf-plot
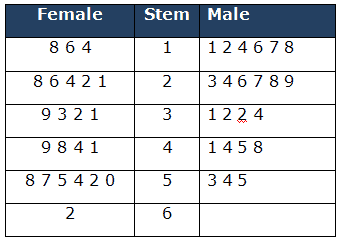
Back to back stem and leaf diagrams can be used to compare different sets of data relating to the same subject. In other words, it helps to compare different sets of data together at the same time.
Example: For the above example, add 23 female students’ books reading data.

Sort the data in ascending order for both male and female. Then identify the stem and respective leaves for male and female.
Stem-and-leaf-plot with Decimals
There are some stem and leaf plots out there that have decimals along with it. When you are tracking your leaves, all you have to do is include the decimal points as well.
It is not that different from a normal stem and leaf plot, only in which you have to designate your stems and leaves to where you want them to begin. For instance, your stems may be the ones place while your leaves are the decimal points. It is all in how you do the graph and what numerical information you are trying to convey. Stem and leaf plots are very flexible this way.
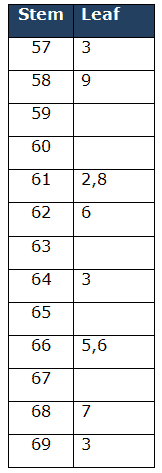
Example: The average heights of ten high school students in inches are reported below. Draw a stem and left diagram for the following students’ heights data.
61.2, 69.3, 58.9, 57.3, 61.8, 62.6, 66.5, 68.7, 66.6, 64.3
Stem and Leaf Plot Activities
There are many different activities in which you can involve a stem and leaf plot. For example, If there is a football game going on, you can track the number of yards someone has run; to make stem and leaf plots even more fun, you can even track the score in a video game and see who has the highest data on the plot.
There is no shortage of activities, usefulness, and fun a stem and leaf plot can achieve. It is up to you to find out the different ways to utilize them and make your own graph.
Videos
Notes on Stem and Leaf Plots
- Box Plots, Histograms, and Stem and Leaf plots all display the same data.
- Histograms are better when you only care about shape and have large datasets. Stemplots preserve data values and work best with medium-sized datasets.
When you’re ready, there are a few ways I can help:
First, join 30,000+ other Six Sigma professionals by subscribing to my email newsletter. A short read every Monday to start your work week off correctly. Always free.
—
If you’re looking to pass your Six Sigma Green Belt or Black Belt exams, I’d recommend starting with my affordable study guide:
1)→ 🟢Pass Your Six Sigma Green Belt
2)→ ⚫Pass Your Six Sigma Black Belt
You’ve spent so much effort learning Lean Six Sigma. Why leave passing your certification exam up to chance? This comprehensive study guide offers 1,000+ exam-like questions for Green Belts (2,000+ for Black Belts) with full answer walkthroughs, access to instructors, detailed study material, and more.

Comments (2)
stem and leaf…I can do!
I believe in you, Sharon!