A project priority matrix – also known as a prioritization matrix – can help you work out and negotiate priorities for a project. It can also be used to prioritize projects themselves, although opinions are mixed on whether this usage is a good idea.
When to Use a Project Priority Matrix
Use a project priority matrix when you need to decide:
- Which feature your team should start next.
- How to delegate tasks.
- A priority order for bug/issue fixes.
- Which area of a large project requires the most attention.
- How to structure your day.
Time/Performance/Cost Project Priority Matrix
A super simple version of a priority matrix maps three basic, competing priorities in any project:
- Time: how long the project will run.
- Performance (or scope): how many features, or the level of quality, the project needs.
- Cost: how much the project will cost the company; or how much the end product will cost the consumer.
| Time | Performance | Cost | |
|---|---|---|---|
| Constrain | X | ||
| Enhance | X | ||
| Accept | X | ||
These three priorities interact and compete in any project. Typically, you’ll get a better level of performance if you allow more time for the project. Also, more money will often allow for better performance. But it’s rarely useful to just throw time and money at a project. For a start, at some point, you’ll hit diminishing returns: extra money or time only slightly improving quality. Also, a high-quality product might rank behind competitor products or at a cost that most of the target market doesn’t want to pay, leading to poor sales.
This matrix maps time, performance, and cost against three actions:
- Constrain: Actively work to decrease this factor.
- Accept: Let this factor be as large as necessary.
- Enhance: Actively work to increase this factor.
How to create a time/performance/cost matrix
This is a very simple tool, but it requires good information to get good results. You should create this matrix before developing a roadmap for the project.
- Gather your project’s stakeholders.
- Explain the concepts involved.
- Talk about what you all want the project to achieve.
- Come to a consensus on which factors to constrain, accept, and enhance.
- Draw up the matrix.
- Base your roadmap development on this matrix.
Impact/Urgency Mapping
You can use the Impact/Urgency Mapping matrix to map the effect of a task against the expected timeframe it takes to complete. The Impact and Urgency aspects of ‘important’ often get conflated, so separating them can be very beneficial to a project.
| High urgency | Low urgency | |
|---|---|---|
| High impact | DO Update project progress chart | SCHEDULE Organize weekly meetings |
| Low impact | DELEGATE Answer emails from CTO | DELETE Tasks not relating to the project or position |
This type of project priority matrix has two arms:
- Impact: how key this task or feature will be to the project as a whole.
- Urgency: how soon it needs to be done.
For example, let’s look at two common tasks on a project manager’s plate: charting project progress and answering emails from the CTO.
The project progress chart is high-impact. If you don’t track the project, you don’t know when parts of it are running overtime, which could affect the entire project’s success. However, whether you complete this task today or tomorrow might not matter.
Answering emails from the CTO is not typically high-impact. It’s unlikely to affect the project much, especially if the project isn’t even the topic of conversation. However, the task is time-sensitive: the CTO expects an answer within a few hours, not a few days.
In a basic impact/urgency matrix, you end up with four categories:
- Do: High impact, high urgency.
- Schedule: High impact, low urgency.
- Delegate: Low impact, high urgency.
- Delete: Low impact, low urgency.
How to create an impact/urgency project priority matrix
To create your own impact/urgency project priority matrix:
- List your tasks or features.
- Next to tasks that need to be completed urgently, add a U.
- Next to tasks that will have a big effect on your project, add an I.
- Draw up a blank matrix like the one shown below.
| High urgency | Low urgency | |
|---|---|---|
| High impact | DO | SCHEDULE |
| Low impact | DELEGATE | DELETE |
- In the DO square, add tasks that have both a U and an I next to them.
- Add tasks with only an I next to them to the SCHEDULE square.
- In the DELEGATE square, add tasks that have only a U next to them.
- Add tasks that have neither to the DELETE square.
Petar Ninovski
Impact/Effort Mapping
This type of project priority matrix is similar to the previous one, except urgency is switched out with effort. This can help a team to pick the low-hanging fruit first – a useful strategy for new teams or ones that are in need of a morale boost.
| High effort | Low effort | |
|---|---|---|
| High impact | MAJOR TASKS Develop prototype | QUICK WINS Create a social media teaser |
| Low impact | THANKLESS Intra-team update bulletins | FILL-INS Minor bug fixes |
An impact/effort matrix has two arms:
- Impact: how key this task or feature will be to the project as a whole.
- Effort: how much work the task or feature will require.
For example, let’s look at two common tasks in creating a new product.
Creating social media teaser posts about the new product might only require two or three days of work for a month’s worth of posts (low effort). However, if done well, those posts might raise a swell of interest in the target market (high impact).
Putting together a prototype of the new product is essential because the company needs to check viability and display something at trade shows (high impact). However, putting together that prototype will take months of solid work (high effort).
In a basic impact/effort matrix, you end up with four categories:
- Major tasks: High impact, high effort.
- Quick wins: High impact, low effort.
- Thankless: Low impact, high effort.
- Fill-ins: Low impact, low effort.
How to create an impact/effort priority matrix
To create your own impact/effort project priority matrix:
- List your tasks or features.
- Next to tasks that will take a lot of work, add an E.
- Next to tasks that will have a big impact on your project, add an I.
- Draw up a blank matrix, like the one shown below.
| High effort | Low effort | |
|---|---|---|
| High impact | MAJOR TASKS | QUICK WINS |
| Low impact | THANKLESS | FILL-INS |
- In the MAJOR TASKS square, add tasks that have both an E and an I next to them.
- Add tasks that only have an I next to them to the QUICK WINS square.
- In the THANKLESS square, add tasks that have only an E next to them.
- Add tasks that have neither to the FILL-INS square.
Weighted and Scored Priority Matrix
In this style of project priority matrix, you use criteria and weightings to come up with scores for each competing feature, task, or project.
| Contenders | Criteria | |||||
|---|---|---|---|---|---|---|
| Standards | Strategic goals | Customer value | Market | Internal goals | Total | |
| First contender | 30 | 40 | 40 | 10 | 8 | 128 |
| Second contender | 50 | 20 | 30 | 10 | 10 | 120 |
| Third contender | 30 | 50 | 40 | 25 | 16 | 161 |
How to create a weighted and scored matrix
To create a scored and weighted priority matrix, follow the steps below. We’ve added cumulative examples for each step so that you can see the matrix is formed.
List your criteria for the tasks
These should be general factors that will apply to all of the tasks, features, or projects under consideration.
| Criteria |
|---|
| Mandated by government standards |
| Aligns with the company’s strategic goals |
| Brings value to customers |
| Fills an existing void in the market |
| Meets internal team goals |
Decide a rating scale for each of the criteria
To make life easier, use the same number range for each. You don’t have to – but if you don’t, you’ll need to modify your weightings accordingly.
| Criteria | Rating Scale (0-5) |
|---|---|
| Meeting mandatory or voluntary government standards | 0: No applicable standards 5: Meets mandatory standards (product won’t be saleable unless it meets them) |
| Aligns with the company’s strategic goals | 0: Has no relation to existing strategic goals 2-3: Meets some of the strategic goals 5: Meets the most important strategic goals |
| Brings value to customers | 0: Doesn’t add value for any customers 2-3: Adds some value for some customers 5: Adds substantial value for most or all customers |
| Fills an existing void in the market | 0: Replicates products already available 2-3: Offers slightly different functionality, or approaches the offering in a different way 5: Completely different to other products |
| Meets internal team goals | 0: Doesn’t help advance team goals 2-3: Helps advance team goals indirectly 5: Advances key team goals |
Set a weighting for each criteria
In any project, certain criteria will be more important than others. For example, in a project aimed at improving internal processes, you won’t be particularly interested in whether your improvements fill a void in the market. Or, when creating a new product, you typically won’t care much about individual team goals.
Your weighting needs to be a numerical value. The higher the weighting, the more important this criteria is to the project. Don’t include zero in weightings. This can mess up your calculations.
| Criteria | Rating Scale (0-5) | Weighting (1-10) |
|---|---|---|
| Meeting mandatory or voluntary government standards | 0: No applicable standards 5: Meets mandatory standards (product won’t be saleable unless it meets them) | 10 |
| Aligns with the company’s strategic goals | 0: Has no relation to existing strategic goals 2-3: Meets some of the strategic goals 5: Meets the most important strategic goals | 10 |
| Brings value to customers | 0: Doesn’t add value for any customers 2-3: Adds some value for some customers 5: Adds substantial value for most or all customers | 8 |
| Fills an existing void in the market | 0: Replicates products already available 2-3: Offers slightly different functionality, or approaches the offering in a different way 5: Completely different to other products | 5 |
| Meets internal team goals | 0: Doesn’t help advance team goals 2-3: Helps advance team goals indirectly 5: Advances key team goals | 4 |
Score each of the criteria
It’s best to split up for this part because, typically, each stakeholder will have a different (and often valuable!) perspective. Start by grouping people into similar interest areas. For example, in a software project, you might create discrete groups of developers, project owners, marketing people, salespeople, and user advocates.
| Criteria | Rating Scale (0-5) | Weighting (1-10) | Rating |
|---|---|---|---|
| Meeting mandatory or voluntary government standards | 0: No applicable standards 5: Meets mandatory standards (product won’t be saleable unless it meets them) | 10 | 3 |
| Aligns with the company’s strategic goals | 0: Has no relation to existing strategic goals 2-3: Meets some of the strategic goals 5: Meets the most important strategic goals | 10 | 4 |
| Brings value to customers | 0: Doesn’t add value for any customers 2-3: Adds some value for some customers 5: Adds substantial value for most or all customers | 8 | 5 |
| Fills an existing void in the market | 0: Replicates products already available 2-3: Offers slightly different functionality, or approaches the offering in a different way 5: Completely different to other products | 5 | 2 |
| Meets internal team goals | 0: Doesn’t help advance team goals 2-3: Helps advance team goals indirectly 5: Advances key team goals | 4 | 2 |
Calculate the score for each contender
Your ‘contenders’ are the features, tasks, or projects you’re trying to prioritize.
| Criteria | Rating Scale (0-5) | Weighting (1-10) | Rating | Score |
|---|---|---|---|---|
| Meeting mandatory or voluntary government standards | 0: No applicable standards 5: Meets mandatory standards (product won’t be saleable unless it meets them) | 10 | 3 | 30 |
| Aligns with the company’s strategic goals | 0: Has no relation to existing strategic goals 2-3: Meets some of the strategic goals 5: Meets the most important strategic goals | 10 | 4 | 40 |
| Brings value to customers | 0: Doesn’t add value for any customers 2-3: Adds some value for some customers 5: Adds substantial value for most or all customers | 8 | 5 | 40 |
| Fills an existing void in the market | 0: Replicates products already available 2-3: Offers slightly different functionality or approaches the offering in a different way 5: Completely different from other products | 5 | 2 | 10 |
| Meets internal team goals | 0: Doesn’t help advance team goals 2-3: Helps advance team goals indirectly 5: Advances key team goals | 4 | 2 | 8 |
| Total | 128 |
Discuss scores for each contender
This is a very subjective step. Pull all of your groups back together, and talk about the scores you gave each contender. You’ll find that there’s almost always disagreement between the various stakeholders. What’s more, that very disagreement will often dig up important information.
List agreed-upon scores in each criterion for all contenders.
Construct the priority matrix
- List your contenders down the side of your matrix, then add your criteria across the top.
| Contenders | Criteria | |||||
|---|---|---|---|---|---|---|
| Standards | Strategic goals | Customer value | Market | Internal goals | Total | |
| First contender | ||||||
| Second contender | ||||||
| Third contender | ||||||
- Add the agreed-upon weighted scores.
| Contenders | Criteria | |||||
|---|---|---|---|---|---|---|
| Standards | Strategic goals | Customer value | Market | Internal goals | Total | |
| First contender | 30 | 40 | 40 | 10 | 8 | 128 |
| Second contender | 50 | 20 | 30 | 10 | 10 | 120 |
| Third contender | 30 | 50 | 40 | 25 | 16 | 161 |
You can see in the example matrix above that the last option is a pretty clear winner. It hits a lot of strategic goals, meets some industry standards, adds value to the customer, AND fills a void in the current market. Those are all clear advantages.
Combination ID/Matrix Method
This matrix kicks things up a notch in terms of complexity. It combines the matrix concept from the previous methods with an interrelationship diagram (or digraph).
To create one for a project, we first break down the project into detailed components. Then we add those components to both arms of a matrix. The idea is to look at the effects of each component on each of the others.
We use three degrees of influence with the following symbols:
- ⭗: Strong
- ⭘: Medium
- △: Weak
We also specify the direction of the effect:
- ↑ : the row component affects or causes the column component.
- ←: the column component affects or causes the row component.
Note: To get those degrees of influence symbols on a web page, you’ll need the following HTML character codes:
- Strong (one circle inside another): #11095;
- Medium (empty circle): #11096;
- Weak (triangle): #9651;
How to create a combination ID/matrix
Creating a combination interrelationship diagram/matrix is a multi-step process using three different tools.
Tree diagram
- Start with a tree diagram. Break your project down into its component parts. You’ll want at least five.
Interrelationship diagram
- Take the output from the right of your tree diagram – the smallest components. Feed this into an interrelationship diagram. Chart any causal connections between your project components. Ensure that you include the direction of the influence with arrows.
- Still, on the interrelationship diagram, mark the strength of each connection. Use these standard symbols:
- ⭗: Strong
- ⭘: Medium
- △: Weak
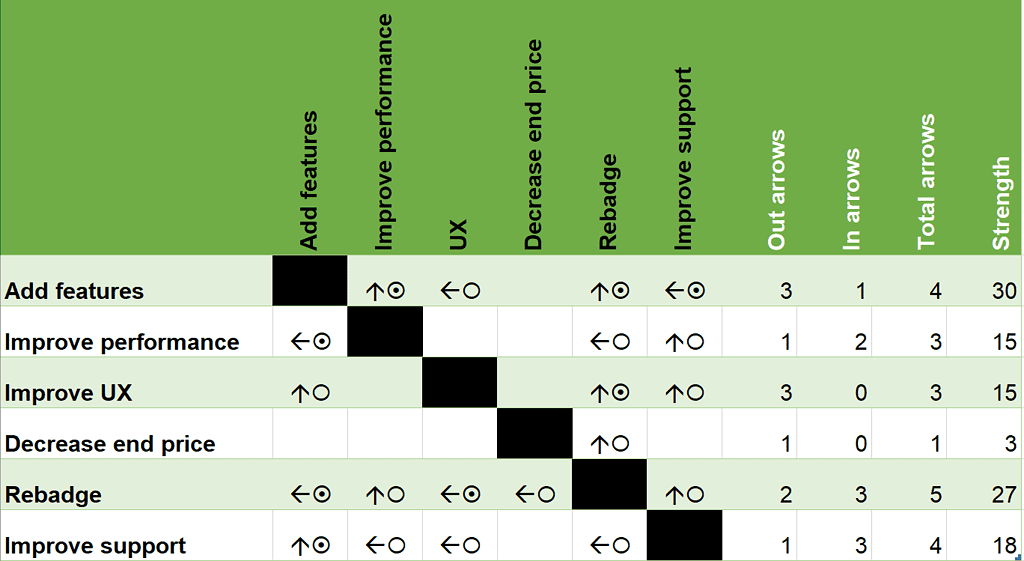
Set up your matrix
- Now start your combination ID/matrix. These are simplest to create in Excel or a similar spreadsheet program.
- List your project components down the side of the spreadsheet.
- List your project components again across the top of the spreadsheet.
- Add columns at the end for:
- Out arrows
- In arrows
- Total arrows
- Strength.
- Block out the cells where the row and column components are the same (no point looking at a component’s relationship to itself).
- Transfer the information from your interrelationship diagram into the spreadsheet.
- Up arrows indicate that the row component affects or causes the column component. These are your out arrows.
- Left arrows indicate that the column component affects or causes the row component. These are your In arrows.
Note: this assumes left-to-right text. If you’re using a language that uses right-to-left text, you’ll have your project components down the right side and use right arrows instead.
Make your calculations
For each component row:
- Count the number of up arrows in the row, and put this number in the Out arrows cell. This is the number of components affected by this one.
- Count the number of left arrows in the row, and put this number in the In arrows cell. This is the number of components that this component is affected by.
- Add the numbers from the Out arrows and In arrows cells. This shows you the number of relationships the component has.
- This step is a little trickier. Count the number of:
- ⭗ symbols in the row, and multiply by 9.
- ⭘ symbols in the row, and multiply by 3.
- △ symbols in the row.
- Add the numbers from the previous step together, and put the result in the Strength cell.
Analysis
Once you have finished the matrix, you can rank your project components by strength. This is effectively a prioritized list, with the biggest priorities at the top and the lowest priorities at the bottom.
The top components are the ones that will have the greatest causal effect on other components. Practically speaking, this means that you should typically first work on the components at the top of your list.
Consensus Criteria Method
The consensus criteria method works similarly to the weighted and scored matrix. However, it relies heavily on a team coming to an agreement on the relative importance of various option/criteria combinations.
If you’re finding that your team disagrees vehemently on these rather subjective points, you might be better off using the full analytical criteria method and the weighted and scored matrix.
How to use the consensus criteria method
You’ll be using more than one matrix throughout this process. You’ll need these matrices:
- Criteria weighting matrix, to come up with weightings for each of your criteria.
- Option scoring matrix, to give a priority score to each option for each criterion.
- Summary matrix, to present your results.
Criteria weighting matrix
Your first step is to weigh the criteria you’ll be using to score the project options.
- Draw up a table with the criteria down the side and team member names or initials across the top.
| AK | HB | LS | UC | WS | QL | Total | |
| Meets industry standards | |||||||
| Furthers strategic goals | |||||||
| Brings value to customers | |||||||
| Fills a market void | |||||||
| Furthers internal team goals |
- Each person has 1.0 points that they can distribute across as many criteria as they want. Stress that this is for the specific project you’re currently focusing on.
The higher the point value, the higher the priority they place on that criterion. - Ask each team member for their weighting.
| AK | HB | LS | UC | WS | QL | Total | |
| Meets industry standards | 0.5 | 0.6 | 0.4 | 0.9 | 0.5 | 0.8 | |
| Furthers strategic goals | 0.5 | 0.2 | 0.3 | 0.2 | 0.1 | ||
| Brings value to customers | 0.2 | 0.2 | 0.1 | 0.3 | |||
| Fills a market void | 0.1 | ||||||
| Furthers internal team goals | 0.1 |
- Add up each row in the Total column.
| AK | HB | LS | UC | WS | QL | Total | |
| Meets industry standards | 0.5 | 0.6 | 0.4 | 0.9 | 0.5 | 0.8 | 3.7 |
| Furthers strategic goals | 0.5 | 0.2 | 0.3 | 0.2 | 0.1 | 1.3 | |
| Brings value to customers | 0.2 | 0.2 | 0.1 | 0.3 | 0.8 | ||
| Fills a market void | 0.1 | 0.1 | |||||
| Furthers internal team goals | 0.1 | 0.1 |
Option scoring matrix
Your next step is to score all options for each criterion. You’ll need one matrix per criterion.
1. Pick your first criteria.
2. Construct a matrix with your options down the side and team members across the top.
| Meets industry standards | ||||||||
| AK | HB | LS | UC | WS | QL | Total | Weighted | |
|---|---|---|---|---|---|---|---|---|
| Improve performance testing metrics | ||||||||
| Add online booking feature | ||||||||
| Add chatbot feature | ||||||||
3. Ask team members to write down their own scores out of 10 for each option.
4. Add these scores to the matrix.
| Meets industry standards | ||||||||
| AK | HB | LS | UC | WS | QL | Total | Weighted | |
|---|---|---|---|---|---|---|---|---|
| Improve performance testing metrics | 5 | 4 | 3 | 4 | 2 | 1 | ||
| Add online booking feature | 1 | 0 | 1 | 0 | 1 | 0 | ||
| Add chatbot feature | 0 | 0 | 1 | 0 | 0 | 1 | ||
5. Add up the scores for each row.
| Meets industry standards | ||||||||
| AK | HB | LS | UC | WS | QL | Total | Weighted | |
|---|---|---|---|---|---|---|---|---|
| Improve performance testing metrics | 5 | 4 | 3 | 4 | 2 | 1 | 19 | |
| Add online booking feature | 1 | 0 | 1 | 0 | 1 | 0 | 3 | |
| Add chatbot feature | 0 | 0 | 1 | 0 | 0 | 1 | 2 | |
6. To get your weighted scores, multiply your total by the total weighting for that criterion from the previous matrix. In this case, the ‘Meets industry standards’ criterion had a weighting of 3.7.
| Meets industry standards | ||||||||
| AK | HB | LS | UC | WS | QL | Total | Weighted | |
|---|---|---|---|---|---|---|---|---|
| Improve performance testing metrics | 5 | 4 | 3 | 4 | 2 | 1 | 19 | 70.3 |
| Add online booking feature | 1 | 0 | 1 | 0 | 1 | 0 | 3 | 11.1 |
| Add chatbot feature | 0 | 0 | 1 | 0 | 0 | 1 | 2 | 7.4 |
Repeat this process for every criterion.
Summary matrix
The job’s final part is to put your results from the previous steps into a summary matrix. This lets you see at a glance the weighted scores for every option.
- Construct a matrix with your options down the side and criteria across the top, with a Total column at the end.
| C1 | C2 | C3 | C4 | C5 | Total | |
|---|---|---|---|---|---|---|
| Improve performance testing metrics | ||||||
| Add online booking feature | ||||||
| Add chatbot feature |
- Add the weighted scores for each criterion/option combination from your option scoring matrices.
| C1 | C2 | C3 | C4 | C5 | Total | |
|---|---|---|---|---|---|---|
| Improve performance testing metrics | 70 | 20 | 39 | 5 | 5 | |
| Add online booking feature | 11 | 82 | 38 | 1 | 0 | |
| Add chatbot feature | 7 | 67 | 34 | 1 | 0 |
- Add up the scores in each row.
| C1 | C2 | C3 | C4 | C5 | Total | |
|---|---|---|---|---|---|---|
| Improve performance testing metrics | 70 | 20 | 39 | 5 | 5 | 139 |
| Add online booking feature | 11 | 82 | 38 | 1 | 0 | 132 |
| Add chatbot feature | 7 | 67 | 34 | 1 | 0 | 109 |
You can see from the table above that the first two options – Improve performance testing metrics and Add online booking feature – are clear winners. You might split the team and set half to each task.
Full Analytical Criteria Method
This matrix helps you rank the criteria you’re judging priorities. As such, it works well with the aforementioned weighted and scored priority matrix. Create one of these before you start looking at your priorities so that you can weigh your criteria accordingly.
This method is a simplified version of Saaty’s Analytical Hierarchy Process (AHP). In it, you compare every criterion to all other criteria and score the comparison. Then you add up each row to come up with a score for each of the criteria.
When should you use it?
Use the full analytical criteria method when:
- You have a small number of criteria (it gets too complex with more than 4 or 5 criteria).
- You fully understand your criteria and goal.
- Your team and stakeholders can achieve consensus on the results.
- Everyone agrees on the stated goal.
How to create a criteria comparison matrix
To create a full analytical criteria method matrix, follow these steps.
Put together your base matrix
- Come up with your list of criteria.
- Draw your matrix.
| Criteria | First criterion | Second criterion | Third criterion | Fourth criterion | Fifth criterion |
| First criterion | |||||
| Second criterion | |||||
| Third criterion | |||||
| Fourth criterion | |||||
| Fifth criterion |
- Block out the same-criteria pairs – no need to compare these.
| Criteria | First criterion | Second criterion | Third criterion | Fourth criterion | Fifth criterion |
| First criterion | |||||
| Second criterion | |||||
| Third criterion | |||||
| Fourth criterion | |||||
| Fifth criterion |
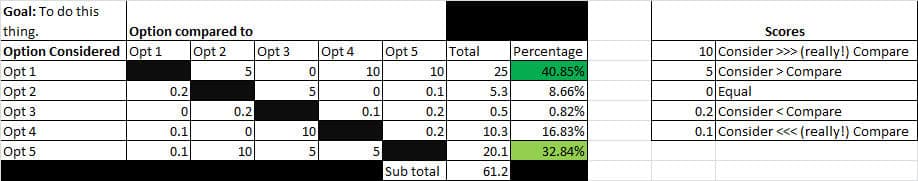
Make your comparisons
- Compare the criteria in each row to the remaining criteria columns. For example, compare the first criterion to the second. Is it:
- Far more important than the second criterion? Assign a value of 10.
- More important, but not hugely so? Assign a value of 5.
- About the same? Assign a value of 0.
- Less important? Assign a value of 0.5.
- Far less important? Assign a value of 0.1.
You’ll end up with a filled-in matrix that looks something like this:
| Criteria | First criterion | Second criterion | Third criterion | Fourth criterion | Fifth criterion |
| First criterion | 10 | 5 | 0.5 | 0.1 | |
| Second criterion | 0.1 | 10 | 0 | 5 | |
| Third criterion | 0.5 | 0.1 | 5 | 10 | |
| Fourth criterion | 5 | 0 | 0.5 | 10 | |
| Fifth criterion | 10 | 0.5 | 0.1 | 0.1 |
Calculate totals
- Add up the values in each row.
| Criteria | First criterion | Second criterion | Third criterion | Fourth criterion | Fifth criterion | Total |
| First criterion | 10 | 5 | 10 | 0.1 | 25.1 | |
| Second criterion | 0.1 | 10 | 0 | 5 | 15.1 | |
| Third criterion | 0.5 | 0.1 | 5 | 10 | 15.6 | |
| Fourth criterion | 0.1 | 0 | 0.5 | 10 | 10.6 | |
| Fifth criterion | 10 | 0.5 | 0.1 | 0.1 | 10.7 | |
| Total | 77 |
- Calculate the percentages of the total for each row.
| Criteria | First criterion | Second criterion | Third criterion | Fourth criterion | Fifth criterion | Total | % |
| First criterion | 10 | 5 | 10 | 0.1 | 25.1 | 33% | |
| Second criterion | 0.1 | 10 | 0 | 5 | 15.1 | 20% | |
| Third criterion | 0.5 | 0.1 | 5 | 10 | 15.6 | 20% | |
| Fourth criterion | 0.1 | 0 | 0.5 | 10 | 10.6 | 14% | |
| Fifth criterion | 10 | 0.5 | 0.1 | 0.1 | 10.7 | 14% |
If you round to a whole percentage, as in the table above, you’re unlikely to get figures that add up to 100%. That’s OK, though. You’re just looking for weightings to use for your criteria, and a rounded one will work fine.
