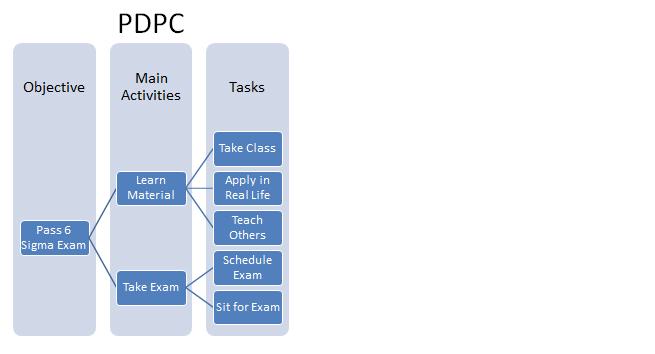
Process Decision Program Charts (PDPC) have two main uses: document steps to completing a process and impact analysis. PDPC does this through a systematic exploration of a process and what could go wrong. This is a helpful project management tool in the Improve phase of DMAIC before implementing your plan, but I find it helpful in the Analyze phase after process mapping to check my understanding of the current state.
Process Decision Program Charts are considered part of the 7 management tools (7M)
When Would You Create Process Decision Program Charts (PDPC)?
Not every Six Sigma tool has to be used on every project. After all, it takes time and effort to implement these things. PDPC is best used when:
- You’re about to enact a new process.
- You’re delivering a large and complex project.
- The cost of the process failing is high.
How to Create a Process Decision Program Chart?
1) First, you start with a tree diagram of your process.
Put your objectives on the first level, main activities on the second level, and the tasks on the 3rd level.

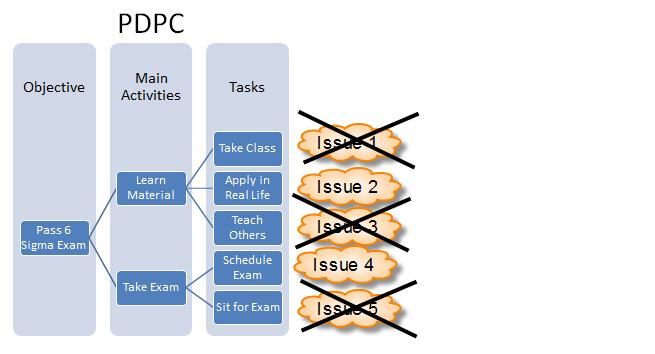
2) Then, you brainstorm issues that could occur while performing those tasks.

Step 3: Cross off issues that are unlikely to happen.

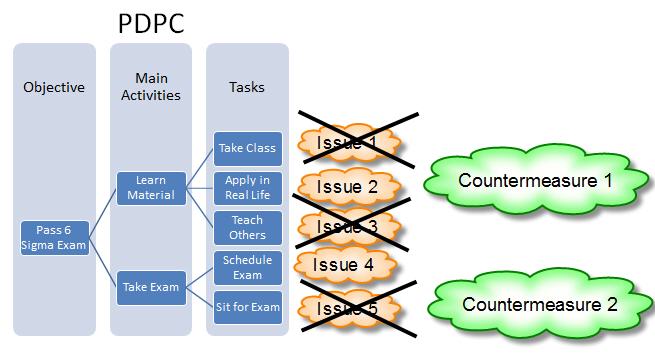
Step 4: Identify countermeasures for the likeliest issues

ASQ Six Sigma Green Belt Process Decision Program Charts (PDPC) Questions
Question: Which of the following tools is used to identify potential events and contingencies for an implementation plan?
(A) PERT chart
(B) Process decision program chart
(C) Fishbone diagram
(D) House of quality
Answer:
B: This is a definition question for PDPC – a Process Decision Program Chart. A Fishbone diagram helps us determine the root cause. The House of Quality helps us translate the voice of the customer to specifics of possible design. The PERT chart (Program Evaluation and Review Technique) is a way to see relationships between different events and tasks.


Comments (11)
Identify the new quality management tool that would be of greater assistance in identifying the impact that various process output variables bring:
A. Prioritization matrices B. Tree diagram C. Activity network diagram D. Process decision program charts
The answer is Process decision program charts (PDPC). PDPCs are used to document a process and complete impact analysis.
A Tree diagram helps you break down big concepts into progressively greater detail, so that doesn’t work.
A Prioritization Matrix is used to help prioritize potential solutions by rating each solution found based on specific criteria using numeric values, so that is a poor answer.
An activity network diagram graphically depicts your project timeline so that doesn’t match either.
This is a classis example of a genius work.
Appreciate the article, it really helps me on my LEAN SIX SIGMA training and certification program.
Thanks, Benjamin. Much appreciated! Let me know what else would help.
There is a question about the placement of the objective at the “end” instead of the “beginning”. I do not understand what circumstances might be in place for that to be the case or to be desirable. Can you provide an example where objectives would go at the end?
Thanks for asking, I am confusing about this question as well.
Michael, Xiang,
The objective would go at the beginning of the PDPC.
I’ve updated the question in the practice set you’re referring to.
Thank you, Ted.
In what order are the process steps presented in a process decision program chart?
Put your objectives on the first level, main activities on the second level, and the tasks at the 3rd level.
bonsoir j’aimerai vous poser une question sur la phrase la ou vous parler des diagrammes de programme de décision de processus sont considérés comme faisant partie des 7 outils de gestion (7M) ,quels 7 outils
Bonjour, Mamady.
I believe you are asking for information on 7m tools. Here’s a link to what I have.
Best, Ted