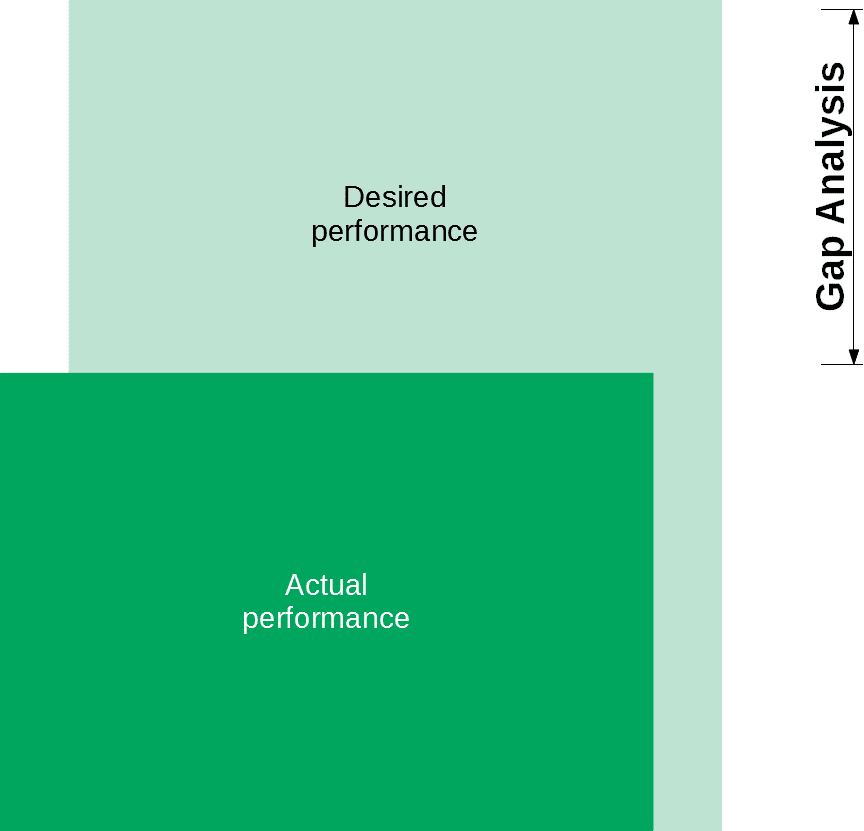
Gap Analysis is an assessment tool we use in Six Sigma. In it, we compare an organization’s current performance to its desired or potential performance.
Steps in a Gap Analysis
The basic steps that you’ll need to follow are:
- Look at the existing situation.
- Figure out the situation you want to be in.
- What is the gap?
- Why is there a gap between these two situations?
- What metrics can you use to measure this gap?
- How can you overcome this gap?
- Develop a list of needed resources and how they can help fill the gap.
Gap Analysis Metrics
There are all sorts of metrics that you can use for gap analysis. The metrics that you choose are crucial to getting good results.
Use metrics that are:
- Measurable
For example, annual income and outgoings are two measurable metrics commonly used in gap analyses. There are lots more, though. Public opinion, production statistics, and market share are just a few examples. - Meaningful
The metrics that you use should be instrumental in bridging the gap. For example, income is not a meaningful metric if your organization’s main issue is negative public opinion. Metrics like social media sentiment score are meaningful in this context. - Improvable
If you can’t improve it, why bother tracking it? Use metrics that you can affect. For example, a company that catches snakes for people in suburbia will likely experience a slump in business over winter. Using the ‘number of callouts’ as a metric might not provide many options for change, whereas the ‘percentage of market share’ would. - Complementary
Sometimes using a single metric will leave out a lot of the picture. For example, imagine that you focus solely on customer satisfaction. Your customer satisfaction is steadily rising, but the number of customers is dropping sharply. The overall situation is bad, but using only one metric makes it look good. Using customer retention rate as a complementary metric would help deliver a more realistic understanding of the situation.
Gap Analysis Example
A not-for-profit organization is running a street kitchen. It serves 200 meals a day to underprivileged people in the neighborhood. However, demand is exceeding supply. The organization is constantly turning people away without meals. A group forms to figure out a solution and decides that a gap analysis would be useful.
1. Existing situation
The organization is currently serving 100 breakfasts and 100 lunches every weekday.
2. Ideal situation
The group does some research about the area. This organization is the only one operating in the area to offer meals. Approximately 1000 people living nearby struggle to obtain nutritious meals every day.
3. Calculating the gap
Not every family needs meals every day. The group estimates that 500 breakfasts and lunches per day would adequately meet the current need. That would mean increasing the number of meals served by 400%.
4. Understanding the gap
The group assumed that lack of supplies would be the primary issue. However, it turns out this isn’t quite the case. While the organization doesn’t currently receive enough funding for five times the amount of food, the main issues are planning and wastage. Lots of food is going cold and therefore inedible. Times between cooking and serving are high. Cooks are used to family cooking and often struggle to maintain the high throughput needed.
5. Metrics
Obviously, the number of meals served per day is an important metric. But after looking at the gap, the group decides to use food wastage percentage and preparation for serving times as well.
6. Resources
The group is out of its depth, as none of its members are professional caterers. So it contacts a few local eateries to ask for assistance in developing a plan of action.
7. Filling the gap
The group meets with industry professionals to get ideas on improving its key metrics. Brainstorming delivers a few workable options. The group votes and comes up with a shortlist:
- Offer more cold options like muffins and fruit. This decreases wastage due to bacteria growth.
- Switch to less complicated meals. This decreases prep time.
- Use production lines. This decreases prep and serving times.
The group estimates that this will increase the number of meals served to 300 per meal. This gets the organization halfway to its target of 500 per meal.
