The main objective of a lean system is to augment the effectiveness and efficiency of various processes in the organization by reducing waste in operations like long lead times, defects, and bottlenecks in material and information flow. One tool that can be used is ‘Value Stream Mapping.’
Value stream mapping visually represents the organization’s flow of materials and information. It helps to identify, demonstrate, and reduce waste and creates effective flow through all the processes in the manufacturing organization.
Value stream mapping constitutes all the value-added and non-added values required to make the product. It consists of the process flows starting from the raw materials to making the product finally available in the hands of the customers.
What Does Value Stream Mapping Do?
- Graphically illustrate the flows of materials and information in a process. It displays the interaction between multiple organizational functions–manufacturing and ancillary functions.
- Pinpoint the problem areas, inefficiencies, defects, and bottlenecks more efficiently as it integrates and maps the information and material flow along with the sequence of tasks. It even shows the cycle times and lag times between different tasks.
- Involves all the stakeholders in each stage of the process; hence, it becomes easy to develop and implement countermeasures to facilitate organizational cultural change. It provides a proper presentation of all the limiting factors.
- Continuous improvement is facilitated since the direction can be focused on lean transformation teams, front-line supervision, and upper management.
Value Stream Mapping Symbols

How to Make and Use a Value Stream Map
Step 1: Understanding the current state
The best way to start here is by making a process map.
The first step is to select the product or product family, decide on the improvement goal and train the team for value stream mapping. Select a cross-functional team and include all the stakeholders of the process. Then, walk through the physical path of the material or information flow. It is necessary to map all the primary as well as secondary flows.
While walking through all the material flow paths, observe and document all the communication points carefully. This will help to prepare the current state value stream map.
Identify the start and endpoints of your process.
In the end, your process owner or project sponsor is the final rule on when a process begins and ends, but in a value stream analysis, this is typically from the moment a customer requests to the moment they receive the product. Arguments could be made for capturing the whole process by including things like transaction settlement (funds clear an account, restocking or retooling takes place, all “technical debt” is completed, etc.)
Draw the process flow.
Map your process, including sub-steps. It’s helpful to trace the flow of one unit (product or service) going through the process.
Note areas that require inputs or outputs. Does that alter your diagram? Did you miss a step? Be sure to include those interactions with external teams.
Include metrics for each process step.
What measures you take depends on what kind of project you are doing. What can you afford to measure? Some processes are trickier or more expensive to measure than others. Even with unlimited resources, the spread and center of your process distribution might affect the measures you need. Perhaps an average is OK in a normal distribution case, but you might want to measure the median in another.
Before measuring, you may want to validate your measuring systems first / auditors to ensure their accuracy with a repeatability and reproducibility study. Gathering this data can be time-consuming; it is best to get it right to the precision required the first time. No matter what you measure, you might want to test your measurement tools.
What are the bounds of the case? The lower bound (or fastest time) might be the ‘happy path.’ The upper bound (or slowest time) might be the worst-case scenario.
- What is the average time, or most likely time?
- What is the median time?
- Is there any changeover or prep time required?
- What’s the uptime?
- What are the resources in each step?
- Manpower–how many people, how many shifts?
- What are the machine’s capabilities?
- What is the throughput of this step and delivery performance?
- How much inventory stacks up?
Step 2: Value Stream Mapping
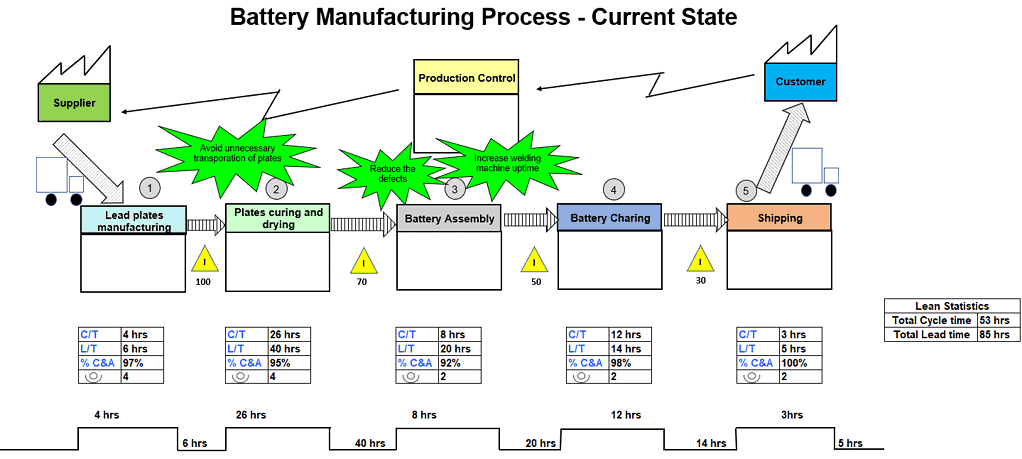
In this step, analyze the current state value stream map with all the stakeholders to gain consensus on the current performance of the process. Next, identify the current process’s limiting factors, deficiencies, defects, and bottlenecks. The performance and cost of each limiting factor should be quantified.
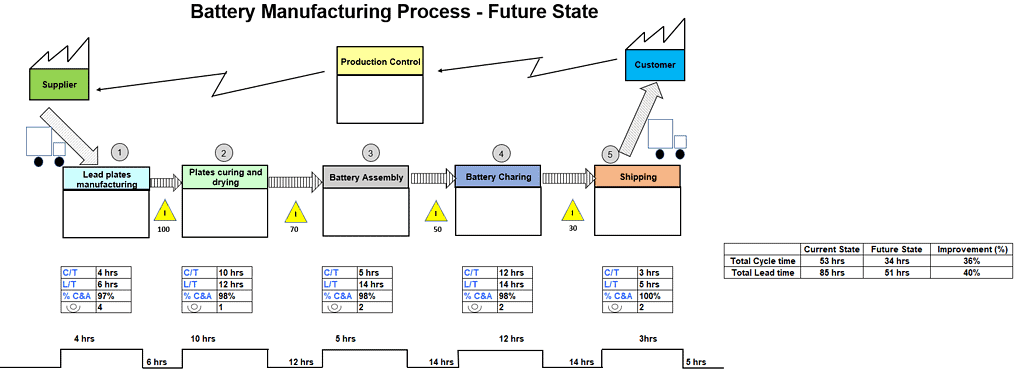
It is also important to identify the root causes and not the symptoms of the limitations of the current state value stream map. Based on the root causes of the limitations, cost-effective solutions should be developed. Finally, the current state value stream map should be amended to reflect the proposed solutions and changes to remove the limitations of the process. The amended value stream map is now called the ‘future state value stream map.’
Look at the value being delivered and the waste incurred.
- Note any wastes, including, but not limited to, wait time, rework time, retooling, and downtime.
- Note any process steps that are not valuable.
How to tell if a step is valuable or not?
- Call out the value-added activities.
- Is it done right the first time, every time?
- Is the customer willing to pay for it?
- Has the process object physically changed?
Calculate Touch Time / Cycle Time
The time a product (physical or completed service) takes to complete the entire process to churn out one piece of the product.
The total time physically spent on a process. This is different than the overall time it takes to complete a process step or task in a stream from start to finish because the waste is not built in.
This is heavily dependent upon defining your starting point and your endpoints. A SIPOC can help you identify these. In the end, the process owner (or the project sponsor) has the final rule on when a process begins and ends.
Also, see calculating Takt Time.
Cycle Time Examples:
Sales: An example cycle time could be when a prospect first contacts your company and ends when they complete a purchase.
Hospital: An example could be from when the patient enters the ER to when they are discharged.
Step 3: Improve
How can we cut out, remove, or avoid those wastes we identified? What are the bottlenecks in our process? What step in the process stream has the slowest throughput or cycle time? Is there a way to make that more efficient?
Before implementing the future state value stream map, socialize and gain consensus from all stakeholders. Then, the changes need to be implemented, and in that process, the affected procedures, bills of materials, and training materials should be modified. Training should be imparted to the staff based on the new procedures and requirements. Finally, implementing the changes should be facilitated on a descending priority basis.
Optimize the Whole.
The point isn’t to achieve a high score for any individual process step but rather to complete a service or produce a product for a customer quicker, utilizing fewer resources while maintaining excellent quality.
Step 4: Sustain
The implemented changes should be verified and validated by establishing and measuring performance and cost-related parameters using effective key performance indicators. The new standard procedures should be monitored and reinforced continuously.
Examples of Value Stream Mapping and Value Stream Analysis
Value Stream Mapping (VSM) and Value Stream Analysis are concepts commonly used in lean management and continuous improvement methodologies to analyze, visualize, and optimize processes within an organization.
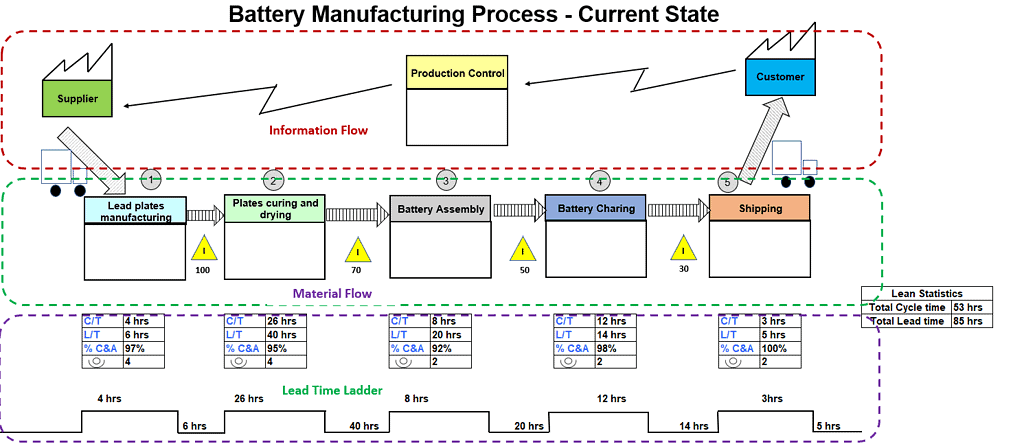
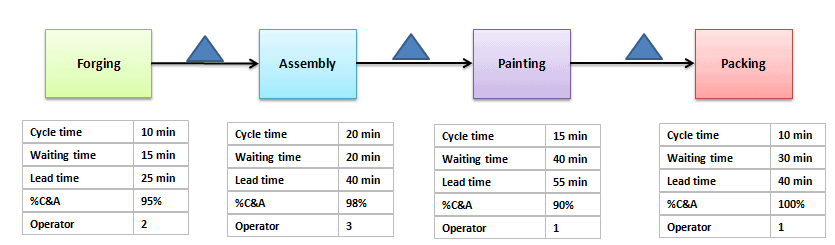
Example: XYZ is a battery manufacturing company. These batteries are sent to the distribution agency (customer) based on their demand. XYZ produces the batteries, involving lead plates process, curing & drying of plates, assembly, battery charging, and finally, shipping the batteries to the distribution agency on a daily basis. Lead coils and other components are supplied by ABC supplier twice a week.
XYZ operates for 22 days a month with 2 daily shifts of 8 hours each. It receives orders from the distribution agency on a quarterly and monthly forecast basis. XYZ releases the Material Requirement Plan (MRP) to the plant and the supplier on a weekly basis, based on inventory and customer demand. Additionally, they share the daily schedule with the shipping department.
Value Stream Analysis
Value Stream Analysis refers to the process of critically examining the value stream map to identify opportunities for improvement. It involves analyzing the data and insights gathered from the value stream map to make informed decisions about how to eliminate waste, reduce lead times, and enhance value delivery to customers.
During value stream analysis, teams may focus on various aspects of the value stream and identify the Kaizens to improve the process, such as:
- Identifying bottlenecks and areas of slow flow.
- Highlighting excessive wait times, queues, and delays.
- Pinpointing unnecessary steps in the process.
- Evaluating the balance between supply and demand.
- Assessing the overall value delivered to the customer.
Create future state based on Kaizen improvements and identify the % of the cycle and lead time improvements.
VSM Template
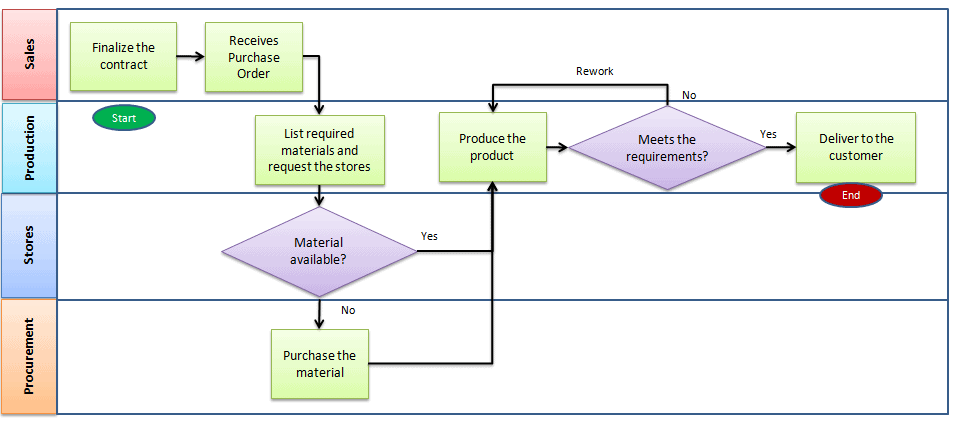
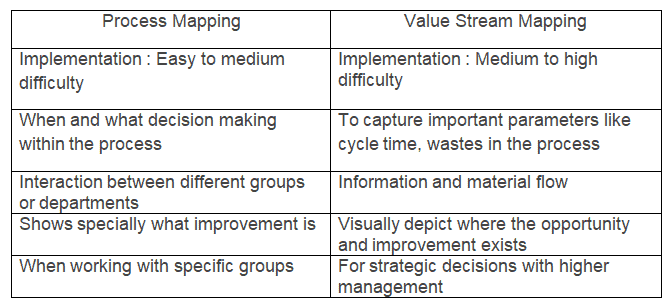
Difference between Process mapping and Value stream mapping (VSM)
Process mapping is a tool that graphically shows a process’s inputs, actions, and outputs in a clear, step-by-step map of the process. Process mapping specifies the tasks within the function and also shows the interaction between functions or departments. It helps to visualize the process’s details closely and guides decision-making.
Value stream mapping visually represents the organization’s flow of materials and information. It shows important parameters like cycle time, lead time, inventory or waiting time, percent complete, and the number of operators. It helps identify, demonstrate, reduce waste, and create effective flow through all manufacturing or business processes. Three important steps of VSM:
- Create an as-is current state process of how an organization delivers products and services to the customers.
- Identify wastes in the process and draw the proposed improved state map using lean principles.
- Develop action plans to achieve the proposed improved future state.
Organizations select either process mapping or value stream mapping based on business requirements. Use VSM to determine how much time the product spends on each step and waste in the process. At the same time, process mapping shows a series of steps and determines the decision-making within the process.
Value Stream Videos
A great introduction from Gemba Academy
A great practical example from Gemba Academy
ASQ Six Sigma Green Belt Value Stream Questions
Question: In order for value flow analysis to be effective, a team must take which of the following steps first?
(A) Define the value stream
(B) Eliminate backlogs in the value stream
(C) Identify overlapping functions in the value stream
(D) Identify specific work practices within the value stream
Answer:
A: Define the value stream. This includes a starting point and an ending point of the process. You cannot do any of the other answers until you have mapped the value stream.

Comments (8)
Answer “A” completely correct, but when I have performed a quiz correct answer was “B”. I think it was teechnical mistake, so check out please and correct for future users.
Hi – I checked it out and it looks all set. Thanks for leaving a note!
Thanks for posting this, explained the Value Stream Mapping concept in an easy along with the steps. Also the attached videos are quite insightful. That’s what I was looking for.
Glad it helped, Atul! Let me know what else would be helpful.
What happens if you miss a step? How do you avoid missing a step in the VSM process?
Noel, I’m assuming that by step you mean a step in your process, not in actually performing a Value Stream Analysis itself.
In that case you might miss the opportunity to get a full understanding of the process. If you take action based off of a flawed analysis, you can end up without the improvements you’re looking for OR causing unintentional errors when you roll out the change.
Is “Touch time” same as “Takt time”? If not what is the difference?
Hi Charisse,
Thank you for the question. Touch time and Takt time are different.
Takt time = Net Available time / Customer Demand. (See comprehensive article on Takt time here.)
While Touch time is the time a product (physical or completed service) takes to complete the entire process to churn out one piece of the product.