Gage Repeatability and Reproducibility are often referred to as Gage R&R. It’s a method to assess the repeatability and reproducibility of a measurement system. In other words, Gage R&R studies are carried out to discover how much of the process variation is due to the measurement system.
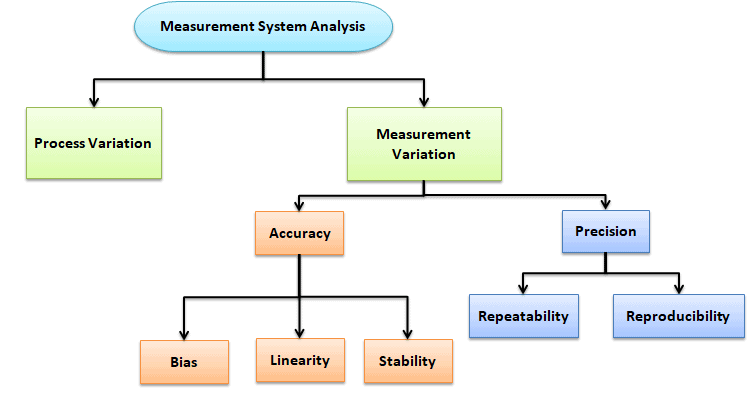
What is a Measurement System Analysis?
Measurement System Analysis (MSA) is a tool for analyzing the variation present in each inspection, measurement, and test equipment type. It is the system used to assess the quality of the measurement system.
What is a Gage and Gage Repeatability and Reproducibility?
A gage, in this context, is a tool for measurement. A gage could be simple, like calipers and rulers. Or it could be a complex piece of machinery. It could even be a piece of software.
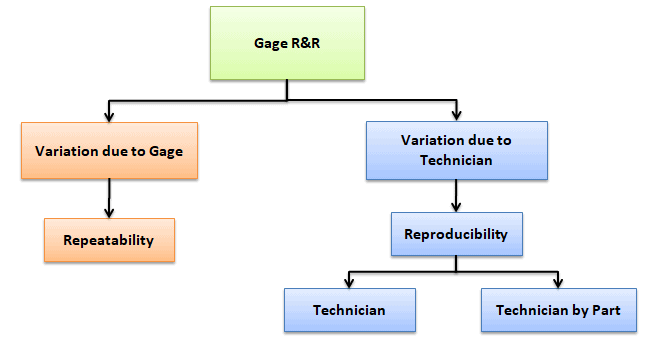
Gage R&R focuses on two key aspects of measurement:
- Repeatability: Repeatability is the variation between successive measurements of the same part or trait by the same person using the same gage. In other words, how much variation do we see in measurements taken by the same person, on the same part, using the same tool?
- Reproducibility: Reproducibility is the difference in the average of the measurements made by different people using the same instrument when measuring the identical characteristics on the same part. In other words, how much variation do we see in measurements taken by different people on the same part using the same tool?
Looking at these two metrics helps us to understand variation in our measurements. When we understand it, we can combat it.
Why is Gage Repeatability and Reproducibility Important?
Gage Repeatability and Reproducibility measure the amount of variability in measurements caused by the measurement system itself. Then, it compares this variability with the total to determine the actual variability of the measurement system. Gage R&R is very important when new workers are assigned; new tools are used, or any significant process changes.
For example, imagine a situation where our performance metrics show a serious problem in our manufacturing process. We spend a lot of time and money trying to fix it and improve the performance of a process. But we’d have noticed serious measurement variations if we’d spent some time looking at gage repeatability and reproducibility instead. The problem wasn’t in the process at all; it was in the measurements. Checking this first would have saved time, money, and stress.
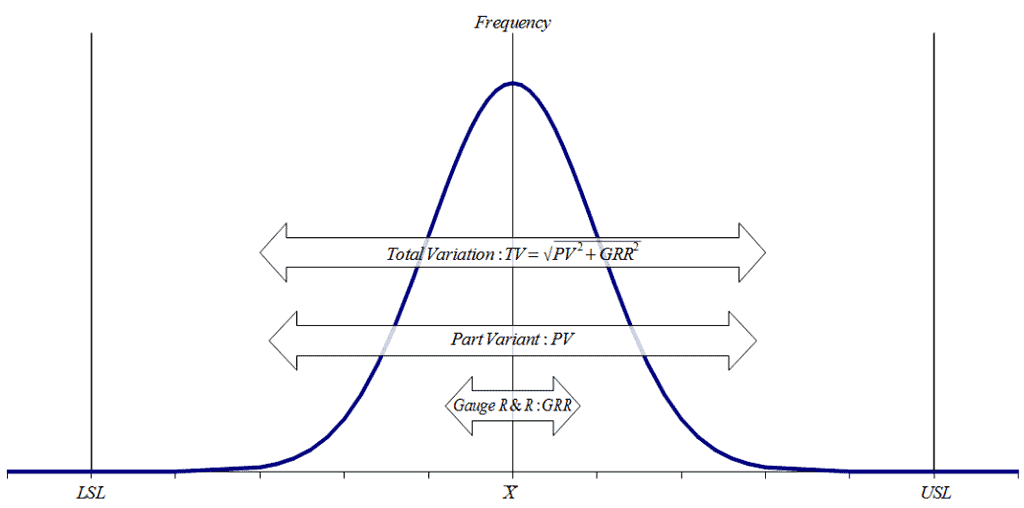
Image from Bo-ci-an under CC-BY-SA 3.0.
Types of Gage Repeatability and Reproducibility Study
Based on the available data and data type, there are basically three types of Gage R&R available:
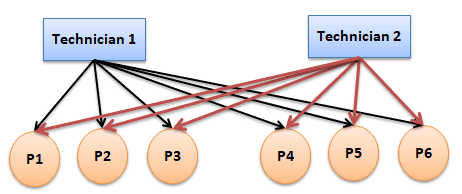
Crossed Gage R&R
Select crossed-gage R&R when each operator measures each part, and it must have a balanced design with random factors. It is used for non-destructive testing.
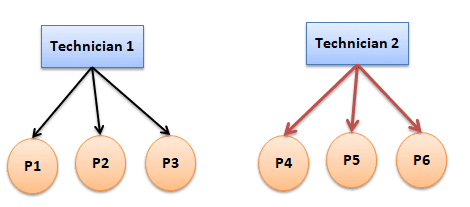
Nested Gage R&R
Select nested gage R&R when only one operator measures each part. It is used for destructive testing. Since it is not crossed with other factors, it is called nested gage R&R. It must have a balanced design with random factors.
Expanded Gage R&R
Select expanded gage R&R when we need to include more factors (maximum of eight) than operator and part. Typically crossed and nested deal with only two factors (operator and part). Design can be balanced or unbalanced.
Methods to Perform Gage Repeatability and Reproducibility Study
There are basically three methods that exist to perform Gage R&R:
- Range method
- Average and range method
- Analysis of variance method
Range Method: The range method will provide a quick approximation of measurement variability but does not compute the measurement system repeatability and reproducibility separately.
Average and Range method: The Average and Range method quantifies the measurement system’s variability and provides repeatability, reproducibility, and part variation. Only crossed Gage R&R can be performed with the Average and Range method.
Analysis of Variance method: It is the most widely used and accurate method for measurement system repeatability and reproducibility. It also quantifies the variability of the interaction between the operator and the parts. Gage R&R (crossed, nested, and expanded) can be done with the ANOVA method.
Gage Repeatability and Reproducibility Using the Average and Range Method
Example of Gage R&R using Average and Range method in a Six Sigma project
Step 1: Calibrate the Gage(s)
Ensure the gages used in the study are properly calibrated before collecting measurements.
Step 2: Collect Measurements
Record a variety of measurements taken by multiple appraisers (operators) on the same parts using the same gage. For each measurement, be sure to note:
- The part being measured
- The person (appraiser) taking the measurement
- The specific gage used
Step 3: Interpret the Results
When all measurements have been recorded, analyze the data to identify sources of variation.
Step 4: Calculate Range and Mean for Each Combination
For example, for Operator A and Part X:
- Range: Max − Min = 0.33 − 0.29 = 0.04
- Mean: (0.29 + 0.31 + 0.33 + 0.32) / 4 = 0.3125
Repeat this process for each combination of operator and part.
Step 5: Calculate Operator-Level Averages
For Operator A:
- Mean of Ranges: (0.04 + 0.04 + 0.04) / 3 = 0.04
- Mean of Means: (0.3125 + 0.2875 + 0.2875) / 3 = 0.2958
Repeat this process for each operator.
Step 6: Calculate Overall Mean Range and Mean Difference
- Total Mean Range (R̅): (0.04 + 0.02 + 0.01) / 3 = 0.0233
- Range of Operator Means (x̅diff): 0.2991 − 0.2958 = 0.0033
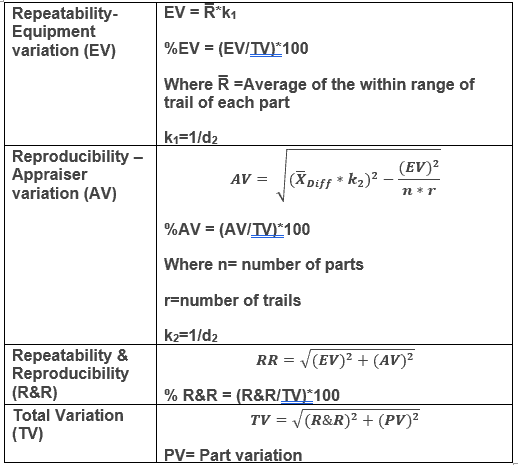
Step 7: Calculate Repeatability – Equipment Variation (EV)
Formula: EV = R̅ × k1
- R̅: 0.0233
- Subgroup size: 4 (number of trials)
- Number of combinations (g): 3 parts × 3 operators = 9
- d2 (from table): 2.080
- k1: 1 / 2.080 = 0.480
- EV: 0.0233 × 0.480 = 0.0112
Step 8: Calculate Reproducibility – Appraiser Variation (AV)
Formula: AV = x̅diff × k2
- x̅diff: 0.0033
- n (number of parts): 3
- r (number of trials): 4
- g (number of combinations): 9
- d2 (from table): 1.718
- k2: 1 / 1.718 = 0.5820
Note: If the calculated AV is negative (e.g., due to rounding or statistical artifacts), set AV = 0.
Step 9: Calculate Total Gage R&R
Add the squared values of EV and AV, then take the square root:
Total Gage R&R = √(EV² + AV²)
Step 10: Interpret the Gage R&R Results
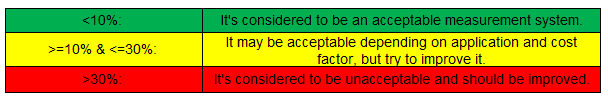
According to the Automotive Industry Action Group (AIAG), %GRR guidelines are as follows:
- Less than 10%: Acceptable
- 10%–30%: May be acceptable depending on application and cost
- Greater than 30%: Not acceptable
Example: If Total Gage R&R = 1.12%, the system is in the green zone and considered acceptable for most applications.
How to Measure Gage Repeatability and Reproducibility Using ANOVA Method
How to Measure Gage Repeatability and Reproducibility Using the ANOVA Method
To measure Gage R&R using the ANOVA method, follow these guidelines:
- Use a minimum of 10 parts for accuracy and robustness.
- Select two technicians (or more) to perform the measurements.
- Each technician should measure each part 2 or 3 times.
- Three measurements per part per technician are typically recommended.
- Measurements should be collected in random order.
- Compute the overall average of all measurements: x̿.
Let:
- t = number of technicians (appraisers)
- r = number of trials or replications
- p = number of parts
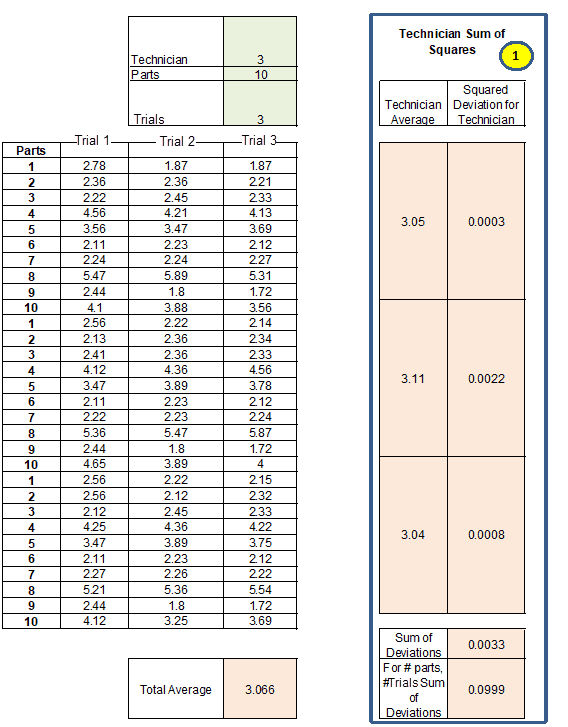
Step 1: Calculate the Technician Sum of Squares (SSTechnician)
This is the sum of squares based on the squared deviations between each technician’s average and the overall average:
SSTechnician = p × r × Σ (x̄Technician − x̿)2
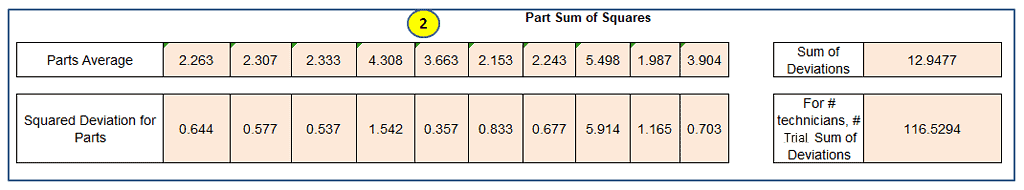
Step 2: Calculate the Parts Sum of Squares (SSPart)
This is the sum of squares based on the squared deviations between each part’s average and the overall average:
SSPart = t × r × Σ (x̄Part − x̿)2
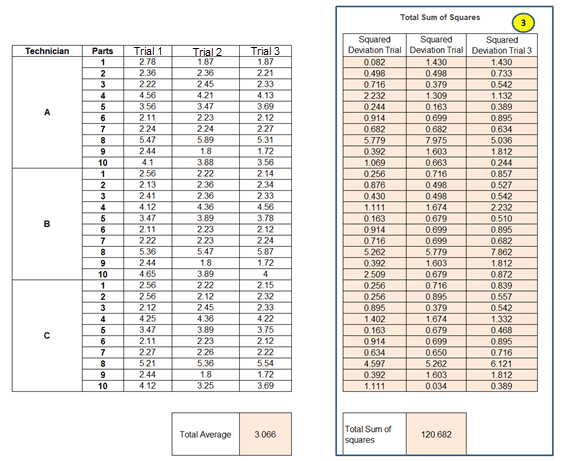
Step 3: Calculate the Total Sum of Squares (SSTotal)
The total sum of squares represents the squared deviation of each individual result from the overall average:
SSTotal = ΣΣΣ (xijk − x̿)2
Or alternately:
SSTotal = SSTechnician + SSPart + SSTechnician×Part + SSEquipment
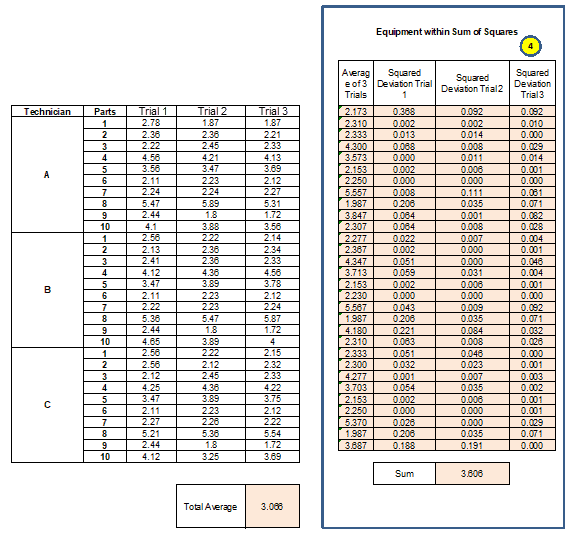
Step 4: Calculate the Equipment (Repeatability) Sum of Squares (SSEquipment)
This reflects variation due to measurement equipment. It’s the sum of squared deviations of individual trial results from the average for the same technician and part:
SSEquipment = ΣΣΣ (xijk − x̄ij)2
Step 5: Calculate the Interaction Sum of Squares (SSTechnician×Part)
This represents variability from interactions between technicians and parts. It’s calculated as the remainder after subtracting other components from the total:
SSTechnician×Part = SSTotal − (SSTechnician + SSPart + SSEquipment)
What is the Number of Distinct Categories (NDC)
The number of distinct categories is a metric. In gage R&R, the goal is to identify the measurement system’s ability to detect a difference in the measured characteristic. It represents the number of non-overlapping confidence intervals that span the range of product variation.
The formula for the number of distinct categories
Number of distinct categories = (Standard deviations for parts / standard deviation for gage) * √2
So, the number of categories depends on the ratio of the variability in the measuring parts and the variability in the measurement system.
Guidelines for the number of distinct categories
According to the Automotive Industry Action Group (AIAG), the number of distinct categories should be greater than 5 for an adequate measuring system.
- >=5: Adequate measuring system
- =2: Data can be divided into two: say Low and High
- =3: Data can be divided into three: say Low, Medium, and High
- <2: Measurement system of no value for controlling the system
Example of Gage Repeatability and Reproducibility (R&R) using ANOVA method in a Six Sigma project
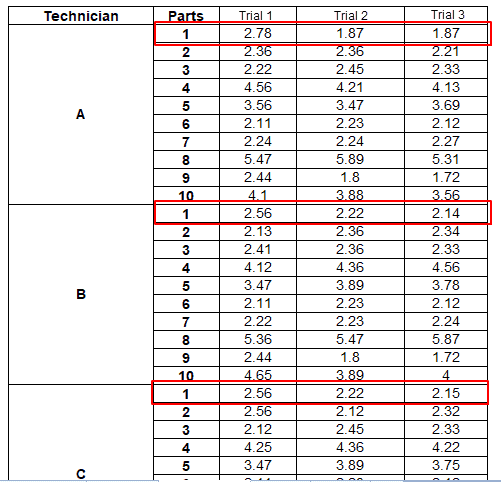
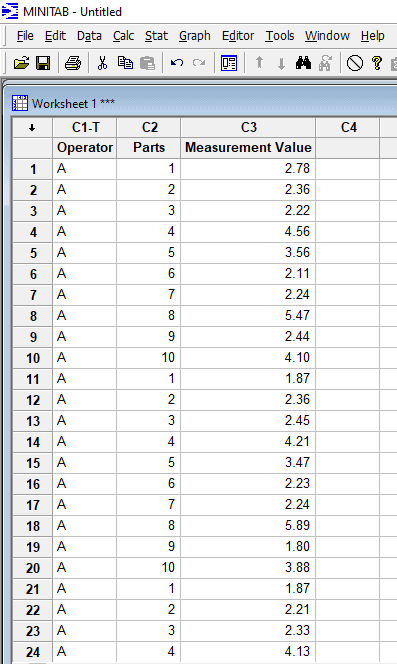
Example: A testing engineer selected ten parts representing the expected range of process variation. Three technicians measured the ten parts three times a part in random. Assess the measurement system Gage R&R.
| Technician | Parts | Trial1 | Trial2 | Trial3 |
|---|---|---|---|---|
| A | 1 | 2.78 | 1.87 | 1.87 |
| 2 | 2.36 | 2.36 | 2.21 | |
| 3 | 2.22 | 2.45 | 2.33 | |
| 4 | 4.56 | 4.21 | 4.13 | |
| 5 | 3.56 | 3.47 | 3.69 | |
| 6 | 2.11 | 2.23 | 2.12 | |
| 7 | 2.24 | 2.24 | 2.27 | |
| 8 | 5.47 | 5.89 | 5.31 | |
| 9 | 2.44 | 1.80 | 1.72 | |
| 10 | 4.10 | 3.88 | 3.56 | |
| B | 1 | 2.56 | 2.22 | 2.14 |
| 2 | 2.13 | 2.36 | 2.34 | |
| 3 | 2.41 | 2.36 | 2.33 | |
| 4 | 4.12 | 4.36 | 4.56 | |
| 5 | 3.47 | 3.89 | 3.78 | |
| 6 | 2.11 | 2.23 | 2.12 | |
| 7 | 2.22 | 2.23 | 2.24 | |
| 8 | 5.36 | 5.47 | 5.87 | |
| 9 | 2.44 | 1.80 | 1.72 | |
| 10 | 4.65 | 3.89 | 4.00 | |
| C | 1 | 2.56 | 2.22 | 2.15 |
| 2 | 2.56 | 2.12 | 2.32 | |
| 3 | 2.12 | 2.45 | 2.33 | |
| 4 | 4.25 | 4.36 | 4.22 | |
| 5 | 3.47 | 3.89 | 3.75 | |
| 6 | 2.11 | 2.23 | 2.12 | |
| 7 | 2.27 | 2.26 | 2.22 | |
| 8 | 5.21 | 5.36 | 5.54 | |
| 9 | 2.44 | 1.80 | 1.72 | |
| 10 | 4.12 | 3.25 | 3.69 |
- t = number of technicians = 3
- r = number of trials or replications = 3
- p = number of parts = 10
Average of all the measurements = (2.78+1.87+1.87+2.36+2.36+2.21+……….+2.44+1.8+1.72+4.12+3.25+3.69)/90= 3.066
Step 1: Calculate the technician sum of squares
Calculate the average measurement for each technician
For technician A: Average value of 3 trials for ten parts = ((2.78+1.87+1.87+2.36+2.36+2.21+……….+4.1+3.88+3.56)/30 = 3.05
Calculate the squared deviation of each technician: squared deviations between the technician average and the overall average:
For technician A: (3.05-3.066)2 =0.0003
Similarly, calculate for technicians B and C
Add all squared deviation for technicians = 0.0003+0.0022+0.0008=0.0033
For the ten parts and three trials, the sum of deviations = 3*10*0.0033 =0.0999
Step 2: Calculate the parts sum of squares
Calculate the average of measurement for each part for all the trials for part 1: (2.78+1.87+1.87+2.56+2.22+2.14+2.56+2.22+2.15)/9=2.263
Calculate the squared deviation of each part: squared deviations of each part and the overall average.
For part 1: (2.263-3.066)2 =0.644
Similarly, calculate values for 10 parts
Add all squared deviations for 10 parts = 0.644+0.577+0.537+1.542+0.357+0.833+0.677+5.914+1.165+0.703=12.9477
For 3 trials and 3 technicians, the sum of the deviations = 3*3*12.9477 =116.5294
Step 3: Calculate the total sum of squares
Calculate the squared deviation for each individual result from the overall average.
For the first part of trial 1: (2.78-3.066)2 = 0.082
Similarly, conduct for all the 90 trials and sum the squared deviation of 3 trials = 0.082+1.430+1.430+……..+1.111+0.034+0.389 =120.682
Step 4: Compute Equipment within the sum of squares
It uses the deviation of all trials for a given part and given technician from the average for that part and technician.
Take the average of the first part of the first technician’s three trials = (2.78+1.87+1.87)/3 =2.173
Calculate the Squared Deviation Trial 1 for first part = (2.78-2.173)2 = 0.368
Similarly, calculate the squared deviation for all trials for each part.
Sum of 90 values = 0.368+0.092+0.092+…………………+0.188+0.191+0.000=3.606
Step 5: Find the interaction sum of squares
SSTechnician*Part = SSTotal – (SSTechnician + SSPart+ SSEquipment)
SSTechnician*Part = 120.682 – (0.0999 + 116.5294+ 3.606) =0.447
Step 6: Create an ANOVA table
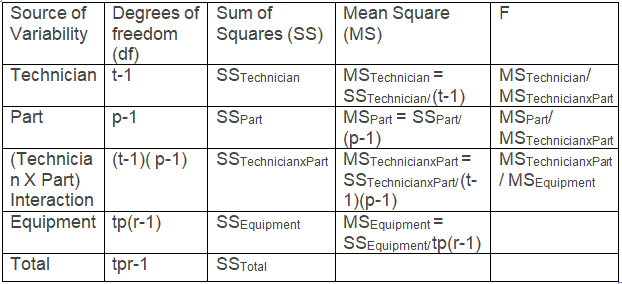
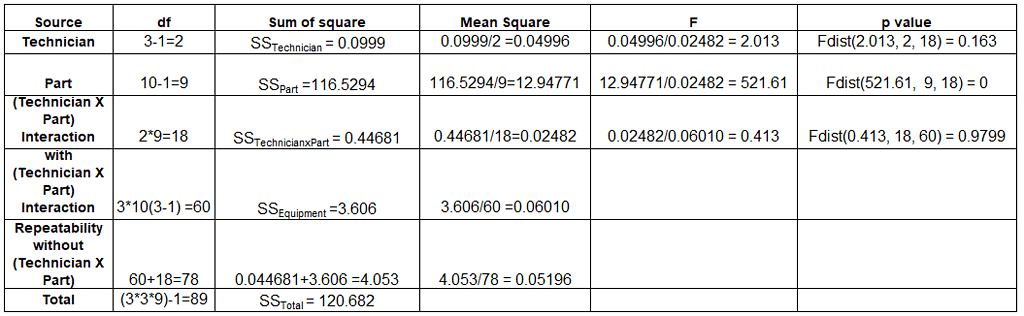
Since the p-value for interaction is more than 0.05, we need to consider the repeatability without interaction values.
Step 7: Evaluate repeatability, technician, part, and interaction variance
- σ2 Repeatability = MSEquipment =0.05196
- Then, σ2 TechnicianxPart = (MSTechnicianxPart – σ2 Repeatability)/ number of trials = (0.02482-0.05196)/3 = -0.00904 =0
- σ2 Part = (MSPart – MSTechnicianxPart)/ (number of trials*number of technician) = (12.9477-0.05196)/(3*3) = 1.4328
- σ2 Technician = (MSTechnician – MSTechnicianxPart)/ (number of trials*number of part) =(0.04996-0.05196)/(10*3) = -0.00006667 =0
Step 8: Compute Gage R&R and interpret the results
- Gage R&R = σ2 Repeatability + σ2 Technician =0.05196+0 = 0.05196
- Equipment Variation (Reliability) = σ2 Repeatability =0.05196
- Technician Variation (Reproducibility) = σ2 Technician + σ2 TechnicianxPart = 0+0 =0
- Part to Part = σ2 Part=1.4328
- Total Variation = σ2 Repeatability + σ2 Part+ σ2 Technician+ σ2 TechnicianxPart = 0.05196+1.4328+0+0 = 1.4848
From the above values, compute the % contribution variance.
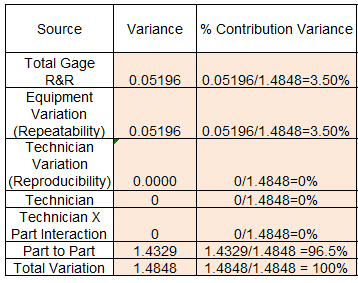
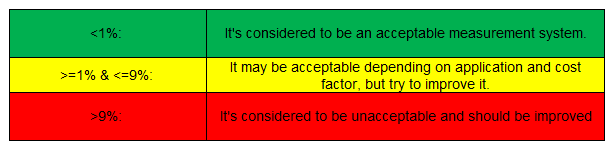
Since the Total Gage R&R is 3.5%, it is in the yellow zone. So it may be acceptable depending on the application and cost factors, but the team needs to improve it further.
Find the standard deviation and % study variance.
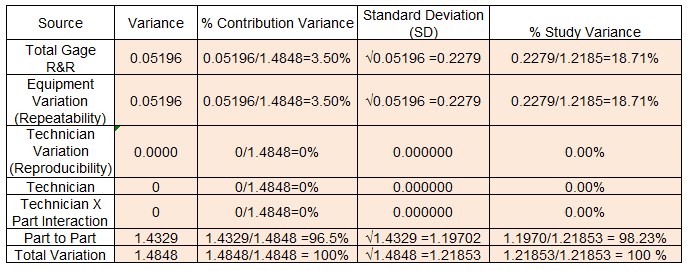
According to the Automotive Industry Action Group (AIAG) measurement system assessment using %GRR.
Since the Total Gage R&R is 18.71%, it is in the yellow zone. So it may be acceptable depending on the application and cost factors, but the team needs to improve it further.
Calculate the number of distinct categories (NDC)
According to the Automotive Industry Action Group (AIAG), the number of distinct categories should be greater than 5 for an adequate measuring system.
Number of distinct categories =(Standard deviations for parts / standard deviation for gage) * √2 = (1.9702 /0.2279) * √2 = 7
Gage Repeatability and Reproducibility ANOVA Excel Template
Gage Repeatability and Reproducibility using Minitab
Step 1: Copy the data in the Minitab sheet
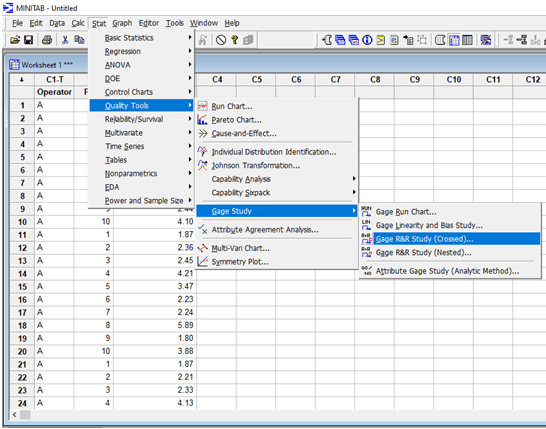
Step2: Select Stat –> Quality Tools –> Gage Study –> Gage R&R (Crossed)
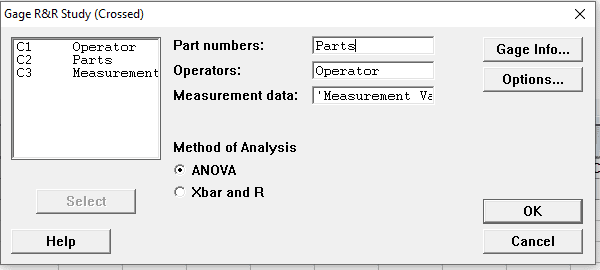
Select Part numbers, Operator, and Measurement data, and select the ANOVA method.
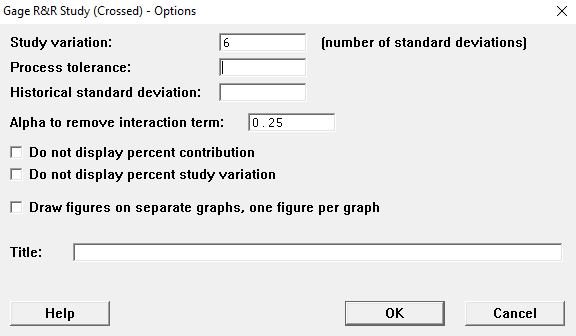
Under options: Enter process tolerance, the default alpha to remove interaction term would be 0.25. click on ok.
Step 3: Interpretation of results (session window)
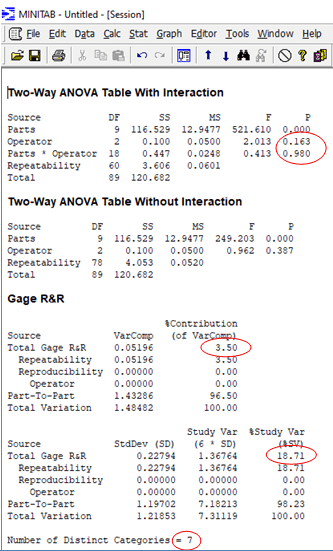
- The p-value for the operator (0.163) is greater than 0.05.
- The p-value for Parts * Operator (0.98) is greater than 0.05. Hence, Minitab ignores the values and considers the values in the without interaction table.
- The part-to-part variation is 96.5x, which is much greater than the total Gage R&R (3.5%). This tells us that there is a lot of variation between the parts.
- Total Gage R&R is 3.5%. So, it may be acceptable depending on the application and cost factors, but there is a scope for improvement.
- Similarly, in the % study variance, the total Gage R&R is 18.71%. According to the AIAG, it may be acceptable depending on the application and cost factors, but the team needs to improve it further.
- The number of distinct categories is 7, which is greater than the acceptable number of 5.
Step 4: Interpretation of results (graphs window)
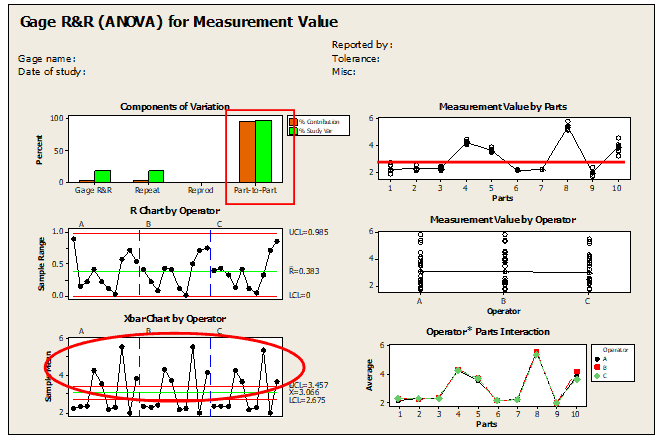
- First Graph- Components of Variation: It clearly shows too much variation is between the part to part, but not due to Gage R&R.
- Second Graph- Measurement values by parts: Clearly indicate the variation between the parts.
- Third Graph- R chart by the operator: All the values are within control limits.
- Fourth Graph – Measurement value by the operator: The difference between operators is small.
- Fifth Graph – X bar chart by the operator: Most of the points are outside of control limits. Hence, it indicates that variation is basically due to the parts.
- Sixth Graph – Operator * Parts Interaction: There is not much difference between the operators, and also there is no interaction between the parts and the operator.
Videos of Gage Repeatability and Reproducibility Charts
Gage R&R Definitions
Precision
- Getting consistent results repeatedly.
- The repeatability of the gage.
Accuracy
- Unbiased true values are obtained.
- Must be assured before an R&R can be performed.
- This is why we calibrate.
Sensitivity
- Ability to detect differences in measurement.
Reproducibility
- We compare the results of different operators at different times.
- We examine variation between the averages of each operator.
Repeatability
- We look at the variation between individual operators.
- We look at the variation within their readings.
Traceability
- The accuracy of a measuring instrument mapped to US national standards.
Attribute Gage Repeatability and Reproducibility
Attribute data is a form of discrete data. Counts rather than measurements denote it. Such as Yes or no, Pass or fail and GO or no GO. It is a complex measurement system because human judgment is involved in most cases. Attribute gage R&R helps to perform such analysis. Ideally, the target for gage R&R would be 100%; however, getting 100% is not always possible. Hence, anything above 90% percent is acceptable.
Attribute Gage R&R Example in a Six Sigma project
- To measure the Gage R&R, it is recommended to measure a minimum of 20 to 30 parts
- Select 2-3 technicians to measure the parts
- Have each technician measure each part 2 or 3 times
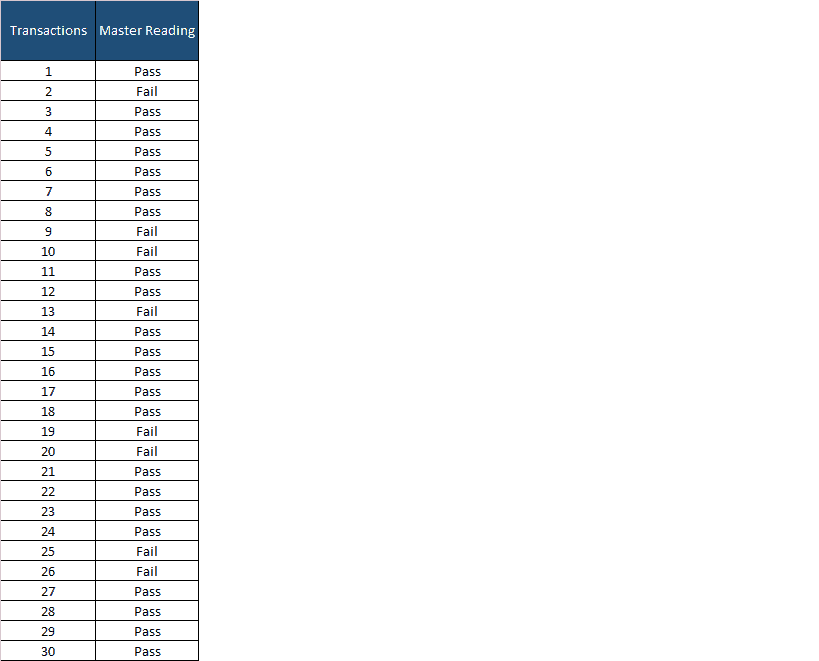
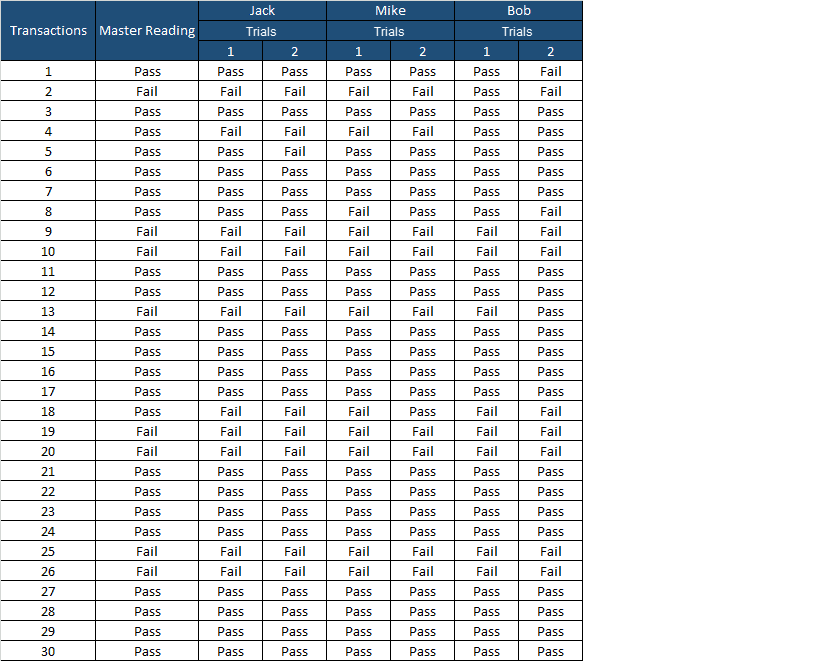
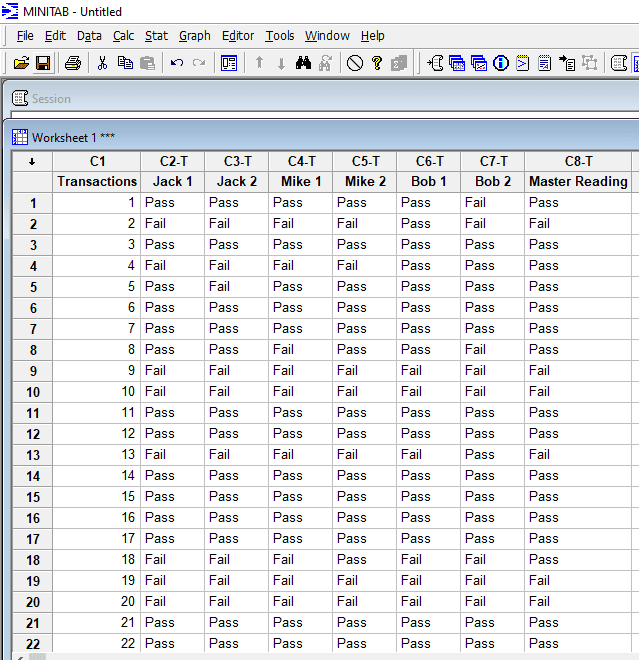
Step 1: Take master appraiser readings
Step 2: Select three Operators and have them categorize each transaction (2 trials) without knowing what the master readings are.
You will use these trials as a sample.
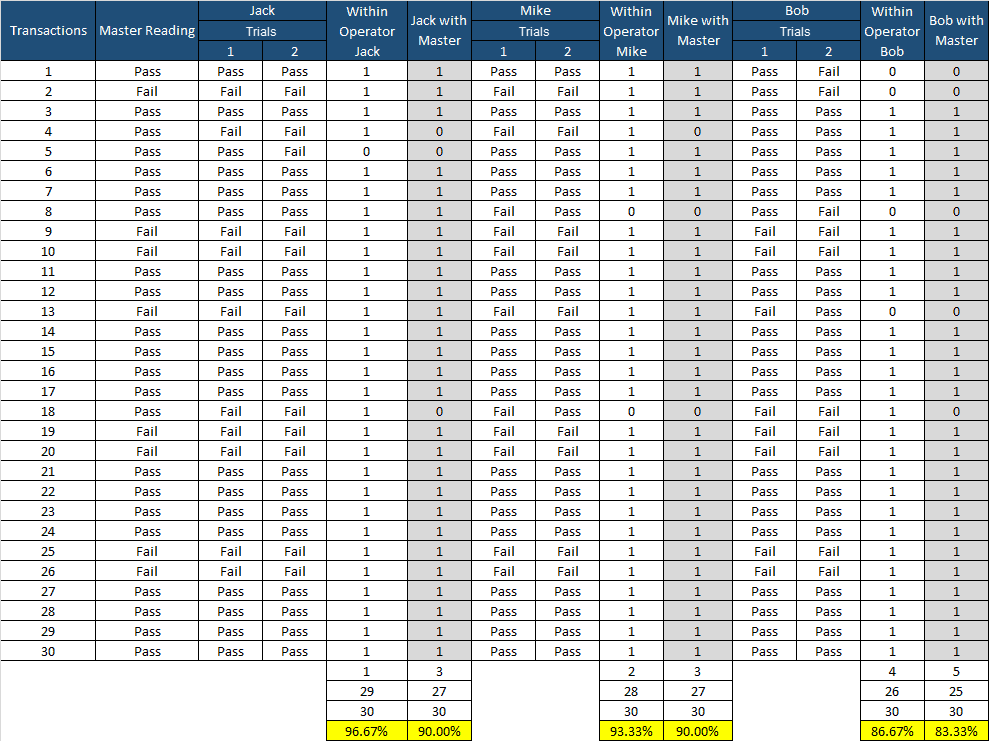
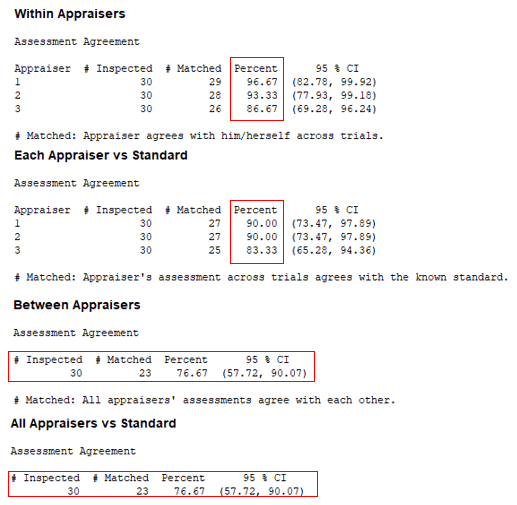
Step 3: Repeatability of the operator- count the number of times the operator readings agree (between two trials). Divide the total agreed number by the total transactions to obtain the percentage of agreement.
- In Excel, we can use the “IF” formula to check that both the trial data sets are agreed upon (C5 and D5 cells). If both are agreed, use 1; otherwise, 0. For Example: =IF(C5=D5,1,0)
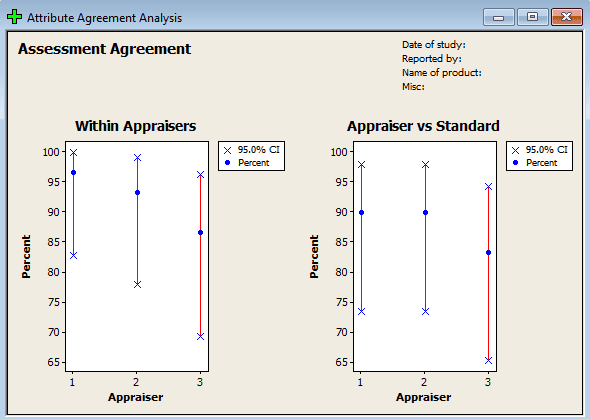
- Operator Jack: Out of 30 Transactions, 29 values are agreed upon between trial 1 and trial 2. So, repeatability of Jack =29/30 = 96.7%
Step 4: Compute each operator vs. Master readings
- Now compare Jack’s two trials values with Master transactions
- In Excel, we can use the “IF” formula to check both the trial data sets agree with the Master reading (C5, D5, and B5 cells). If both are agreed, use 1; otherwise, 0. For Example: =IF(AND(C5=B5,D5=B5,1,0).
- Operator Jack: Out of 30 Transactions, 27 values are agreed upon between trial 1, trial 2, and the master readings. So, the % agreement of Jack’s data set with the master transactions =27/30 = 90.0%.
Similarly, compute for the other the operator’s repeatability and agreement with master readings.
Step 5: Compute reproducibility between operators
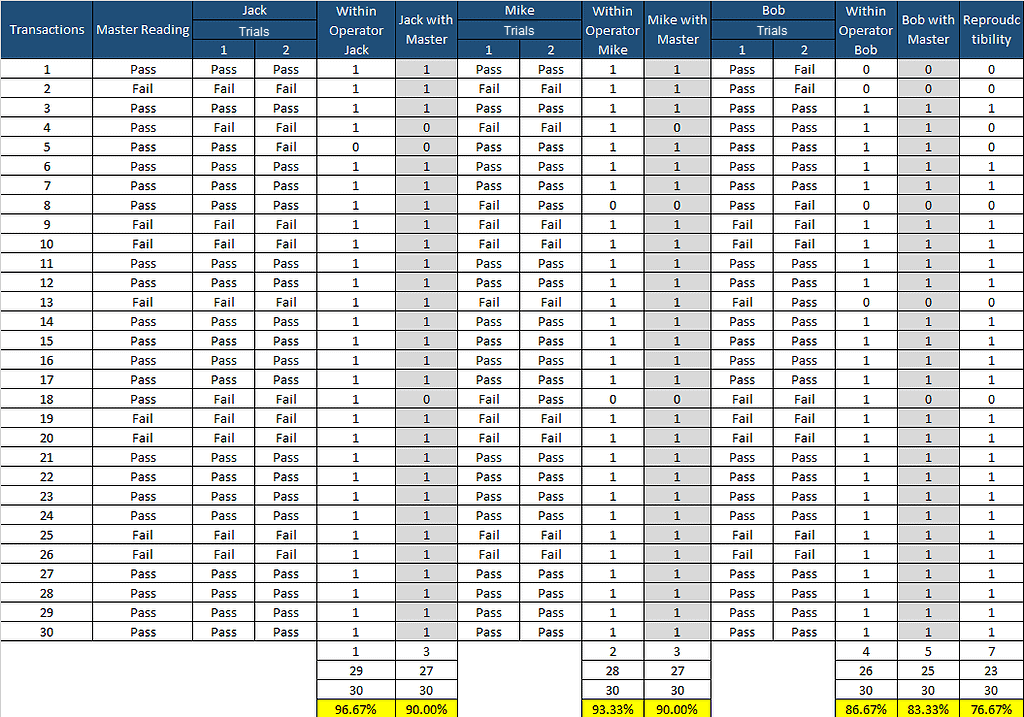
- In Excel, we can use the “IF” formula to check reproducibility between operators (C5, D5, G5, H5, K5, and L5 cells). If all are agreed, use 1; otherwise, 0. For Example: =IF(AND(C5=D5,C5=G5,C5=H5,C5=K5,C5=L5,1,0)
- Reproducibility: Out of 30 Transactions, 23 values are agreed upon between 3 operators. So, the % Reproducibility =23/30 = 76.7%.
Step 6: Overall Effectiveness (All operators vs. Standard) – Compute the percentage of the time that all the operator’s transactions are agreed upon among each other and with the master transaction.
- In Excel, we can use the “IF” formula to check overall effectiveness (C5, D5, G5, H5, K5, L5, and B5 cells). If all are agreed, use 1; otherwise, 0. For Example: =IF(AND(B5=C5,B5=D5,B5=G5,B5=H5,B5=K5,B5=L5,1,0)
- Overall Effectiveness: Out of 30 Transactions, 23 values are agreed upon between 3 operators. So, the % Overall Effectiveness =23/30 = 76.7%
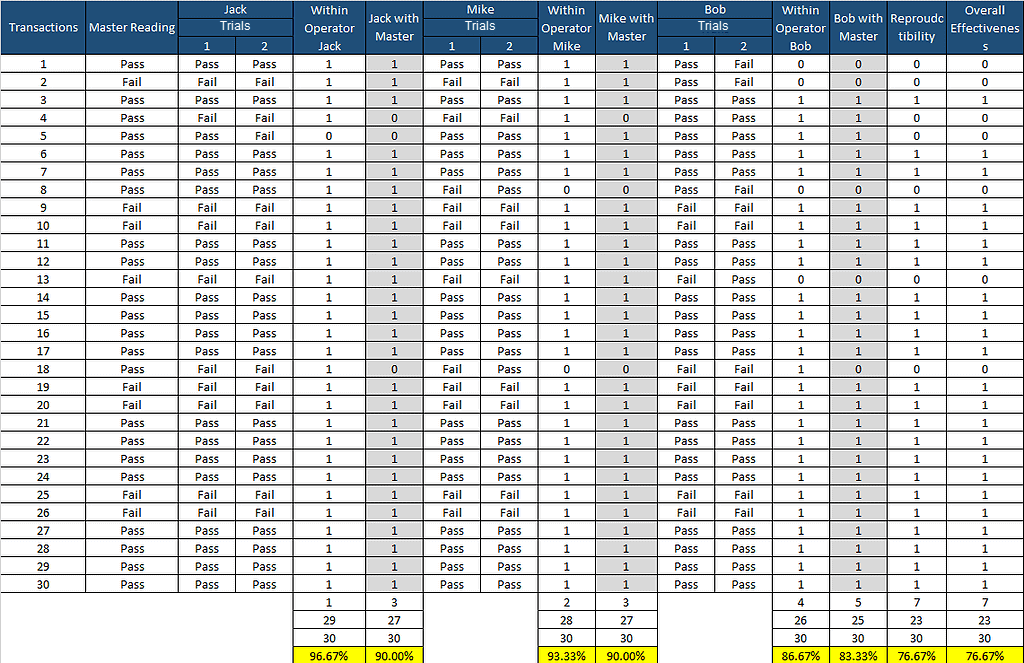
Step 7: Conclusions
As per AIAG acceptance criteria of attribute data MSA:
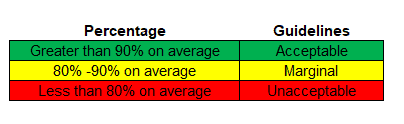
MSA will be failed as the overall efficiency is only 76.7%. MSA Should be greater than 90%. We need to take the appropriate actions for improvement.
Attribute Gage R&R Template for Download
Attribute Gage R&R using Minitab
Step 1: Copy the data in the Minitab sheet
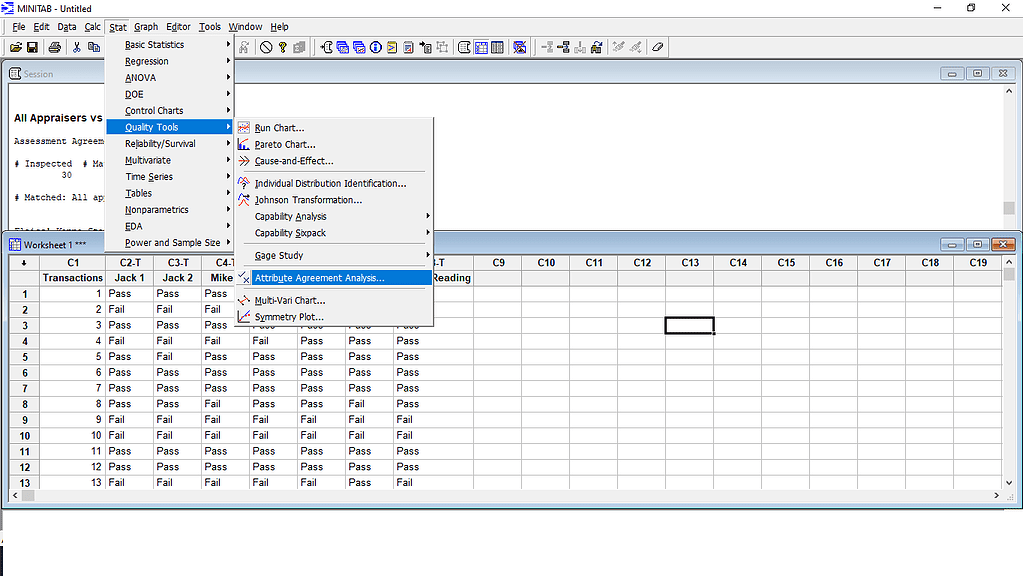
Step2: Select Stat –> Quality Tools –>Attribute Agreement Analysis
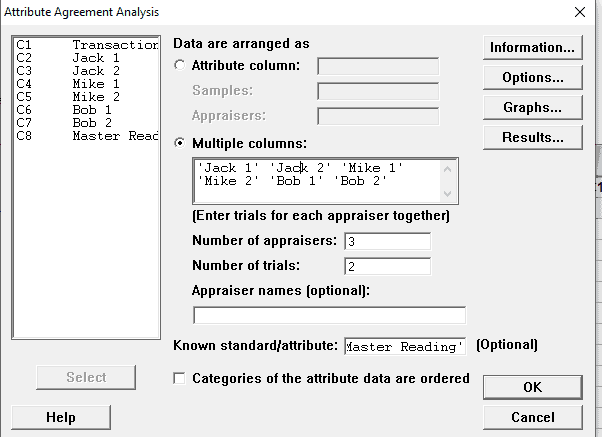
Select the Multiple Columns option and include Operator trials 1 and 2 data, add the number of appraisers as 3, and the number of trials as 2. Add the master values under “Known standard/attribute.”
Step 3: Interpretation of results (session window)
Additional Attribute Gage R&R Articles
- https://www.isixsigma.com/tools-templates/measurement-systems-analysis-msa-gage-rr/making-sense-attribute-gage-rr-calculations/
- https://www.spcforexcel.com/knowledge/measurement-systems-analysis/attribute-gage-rr-comparing-appraisers
- https://asq.org/quality-resources/articles/attribute-gage-rr?id=c9deedbb83da4d248e4f06108e44c006
What You Need to Know for Your Six Sigma Exam
Green Belts
The IASSC Green Belt BOK lists understanding Gage R&R under their Measure Phase.
The ASQ Green Belt BOK describes the following requirements for Gage R&R under Measurement system analysis.
Calculate, analyze, and interpret measurement system capability using repeatability and reproducibility (GR&R), measurement correlation, bias, linearity, percent agreement, and precision/tolerance (P/T). (Evaluate)
Black Belts
The IASSC Black Belt BOK lists understanding Gage R&R under their Measure Phase.
The ASQ Black Belt BOK describes the following requirements for Gage R&R under Measurement system analysis.
Use various analytical methods (e.g., repeatability and reproducibility (R&R), correlation, bias, linearity, precision to tolerance, percent agreement, etc.) to analyze and interpret measurement system capability for variables and attributes measurement systems. (Evaluate)
When you’re ready, there are a few ways I can help:
First, join 30,000+ other Six Sigma professionals by subscribing to my email newsletter. A short read every Monday to start your work week off correctly. Always free.
—
If you’re looking to pass your Six Sigma Green Belt or Black Belt exams, I’d recommend starting with my affordable study guide:
1)→ 🟢Pass Your Six Sigma Green Belt
2)→ ⚫Pass Your Six Sigma Black Belt
You’ve spent so much effort learning Lean Six Sigma. Why leave passing your certification exam up to chance? This comprehensive study guide offers 1,000+ exam-like questions for Green Belts (2,000+ for Black Belts) with full answer walkthroughs, access to instructors, detailed study material, and more.

Comments (73)
You you help to explain how to calculate Gage R & R for true position (with x and y values), please? I dont see any article discuss about this
Thank you very much!
Absolutely, I’d be glad to guide you through calculating Gage Repeatability and Reproducibility (Gage R&R) for true position measurements using X and Y coordinates. This process involves converting X and Y deviations into a single true position value and then performing a Gage R&R study on these values.
Step 1: Calculate True Position from X and Y Deviations
True position is a measure of how far a feature’s actual location deviates from its intended (theoretical) position. When you have deviations in the X and Y directions, you can calculate the true position using the following formula:
True Position (TP) = 2 × √[(X_deviation)² + (Y_deviation)²]
This formula calculates the radial distance from the actual position to the true position, then doubles it to account for the diameter of the tolerance zone. For example, if a hole is measured to be 0.003 inches off in X and 0.004 inches off in Y, the true position would be:
TP = 2 × √[(0.003)² + (0.004)²] = 2 × √[0.000009 + 0.000016] = 2 × √[0.000025] = 2 × 0.005 = 0.010 inches
This calculation provides a single value representing the positional error, which is essential for the subsequent Gage R&R analysis.
Step 2: Conduct a Gage R&R Study on True Position Values
Once you have calculated the true position values for multiple parts, you can perform a Gage R&R study to assess the measurement system’s variability. Here’s how you can proceed:
It’s important to note that when dealing with true position, which is derived from both X and Y measurements, the variability can be more complex. Therefore, ensuring that the measurement system is capable of accurately and consistently measuring true position is crucial.
Additionally, if you’re interested in preparing for Six Sigma certification exams, our courses are designed to align with both IASSC and ASQ bodies of knowledge:
These resources provide in-depth coverage of measurement system analysis and other key Six Sigma concepts.
Sir can you explain why (EV)2 / (n * r)) gets subtracted from (Xdiff * k2)2 in reproducibility calculation ,in the formula?
Please help to understand.
Hi Tanmaya,
We updated the article to switch to the more-accurate & more popular ANOVA method. Does that make sense?
Best, Ted
(EV)2 / (n * r) is a measure of repeatability for the formula. If you try to take reproducibility data in a Gage R&R study and analyze it in a spreadsheet without these formulas, you find a problem where the reproducibility includes repeatability. So this is some really smart statistician’s way of removing repeatability from reproducibility.
Excellent observation! You’re absolutely right. When analyzing a Gage R&R study, it’s critical to distinguish between repeatability (equipment variation) and reproducibility (appraiser variation), especially since reproducibility can appear to include elements of repeatability if not properly separated.
The formula (EV)2 / (n × r) helps isolate repeatability when computing variance components. It adjusts the measurement variation to reflect only what’s attributed to the equipment, excluding appraiser influence. This allows us to accurately calculate the variance due solely to the operator (reproducibility) by removing the repeatability component from the total observed variation.
This statistical nuance is essential for clean analysis; without it, the reproducibility figure could be inflated, misrepresenting how much of the measurement variation is due to operator differences.
How did you get the X-bar min and max figures?
Thanks.
Hi Jovon, I’ll re-write this article with a better description shortly.
Hi Jovon,
We updated the article to switch to the more-accurate & more popular ANOVA method. Does that make sense?
Best, Ted
In case of Operator B, trails 2, range should be 3 not 4.
Hi Rupam,
We updated the article to switch to the more-accurate & more popular ANOVA method. Does that make sense?
Best, Ted
Hi Nguyen, under what circumstances would I get the same figure for % variation and repeatability?
Study Var %Study Var
Source StdDev (SD) (6 × SD) (%SV)
Total Gage R&R 1.3378 8.027 3.80
Repeatability 1.3378 8.027 3.80
Reproducibility 0.0000 0.000 0.00
Part-To-Part 35.2077 211.246 99.93
Total Variation 35.2331 211.399 100.00
Great observation! The scenario you’re describing happens when RepeatabilityReproducibility
Why Are % Variation and Repeatability Equal?
In your study results:
This implies that:
When Does This Happen?
You might encounter this scenario when:
Conclusion
So, when Reproducibility = 0, the Total Gage R&R is solely based on Repeatability. Therefore, their %Study Variation values (%SV) will be the same, as seen in your example: 3.80%.
Additionally, if you’re interested in preparing for your certification, consider our comprehensive courses:
Hi,
I am not sure why you considered different operators for repeatability calculation . As Repeatability is done to check gauge error.
You’re right Manish. I should have clearly specified that the repeatability is solely for each individual calculation and that the reproducability was calculated across all operators.
Repeatability isn’t just gauge error. It is the ability of an operator to get the same value measuring the same part with the same gage.
You use multiple operators in the repeatability calculation because different operators will have different repeatability. It all gets lumped together in the calculations, but you should be looking at more than just the calculations. If you look at the control charts, specifically control charts staged by operator, you can see if one operator is more or less consistent than the others. When you calculate reproducibility in this manner, using the range of the operator averages, are looking for the ability of the operators to get the same average value in the measurement. One operator might get 2, 4, 6, and the second get 3,4,5. They both average to 4 for the reproducibility calculation, but they have two different repeatability’s.
Where you will see this show up often is when measurements have a ‘feel’ to them. Take measuring a cylinder with a caliper for instance. One operator may be more consistent with the pressure on angle they hold the caliper at. That operator is more repeatable within their own measurements. On a depth gage, even if you have them use the ratchet you can get different results for repeatability for different operator. Run it down with one click vs. 3 clicks and you can get different results. Run it down fast vs. slow and you can get different results. If you have repeatability issues from the calculations, you can look at the staged control charts, see if it is a single operator driving it up and then witness their technique. It is possible that retraining is needed, or better work instructions.
Basically, as long as you have an operator involved in the measurement, you won’t have a repeatability value that is not influenced by operator, which is why multiples are included.
This is an outstanding clarification . Thank you!!
You’re absolutely right. Repeatability is fundamentally about an operator’s consistency when measuring the same part with the same gage under the same conditions. And because human technique plays a key role, repeatability inherently includes operator behavior.
That’s why in real-world Gage R&R studies, we use multiple operators because each operator brings their own repeatability pattern to the data. While the calculations ultimately lump these variations together, many practitioners dig deeper. Control charts, especially those staged by operator, provide powerful insights. You might see that one operator introduces more spread than others, which could be a sign of differing personal technique or inconsistency.
Really like your example with calipers and depth gages. Physical ‘feel’ like the pressure applied or the speed and number of clicks on a ratchet can create subtle but significant variations. These are exactly the kind of variations Gage R&R is designed to uncover. Once you detect them, it’s a cue to take corrective action such as operator retraining or refining work instructions.
Reproducibility, on the other hand, reflects the variation between operator averages. As you pointed out, two operators can have very different individual measurement spreads (repeatability), but the same average. (And this would mask the underlying repeatability issue if you’re only looking at the reproducibility number!)
Trying to find the answer for the IASSC Lean Six Sigma Black Belt.
A Gage R & R Analysis is analyzing which two:
A. Reliability
B. Replication
C. R Value
D. Repeatability
I know that Repeatability is one of the answer.
Hi Paula,
I have all of the complete walkthroughs of IASSC BB in my free practice exams here: https://sixsigmastudyguide.com/free/
Best, Ted.
how you calculate d2 is not clear? how d2 is depend on m and g variables?
please explain clearly.
I added a link to a D2 table above.
Here’s the link: http://www.bessegato.com.br/UFJF/resources/table_of_control_chart_constants_old.pdf
on this link the calculation is not clear for d2, can you please elaborate?
Hi Rehnuma,
We updated the article to switch to the more-accurate & more popular ANOVA method. Does that make sense?
Best, Ted
Referring to the statistical table for d2, the number of subgroups (K) you will have in a study like this is your (number of operators)x(number of parts). This can be visually seen by looking at the second table in the example above. There are three operators and three parts which gives nine rows in the table and thus leaves us with nine ranges and nine operator means. That equates to nine subgroups.
When considering repeatability (EV) for determining subgroup size, consider: how many measurements did each operator repeat? The operator repeats a number of measurements equal to the number of trials and this directly affects how many data points go into each range which then affects the repeatability. Therefore, the subgroup size for EV is n=number of trials.
When considering reproducibility (AV), consider: how many measurements does each appraiser make? That will be the number of parts, therefore, n=number of parts.
How to calculate d2 Value
I added a link to a D2 table above.
Here’s the link: http://www.bessegato.com.br/UFJF/resources/table_of_control_chart_constants_old.pdf
Hi Ted
in case of GR&R study on operator. input data is by operator and result is pass or fail, what is a best way to calculate GR&R?
Ang,
Pass / fail data is considered discrete data.
Here’s a good discussion on how to calculate GR&R for discrete data with minitab. Also of interest this one and this one.
Best, Ted.
Hi, how do we then use these results, gage r and r, repeatability and reproducibility to determine the test limits?
Great question! Once you’ve calculated Gage R&R results (specifically repeatability and reproducibility), you can use them to determine and adjust your test limits or acceptance criteria as follows:
P/T = Gage R&R / Process ToleranceHow you obtained the d2 is not clear. I looked in the table and it does not clearly make sense. The d2 used in the example above was 2.079. This number is not anywhere on the table you added a link to. Could you please explain how the number was found?
Thanks!!
Related comment,
How to obtain the d2 is not clear. Mostly because the usage of g is not explained anywhere.
Also, I would like to note that the referenced table is marked as “old” on the file name. Constants would not change during years, and new one has much less explanation, but still I would think that would be preferred to use newer material.
Please, explain the usage of g to obtain d2.
You’re absolutely right that how we arrive at the d2 constant can be unclear without context. Let’s break it down, particularly the use of g in determining the appropriate value for d2.
What is g?
In Gage R&R studies, g refers to the total number of subgroups or combinations of parts and operators. For example, if you have 3 parts measured by 3 operators, each measured 4 times (trials), then:
How to find d2:
The d2 value corresponds to the subgroup size (n), not to g. So in the example, since the subgroup size is 4 (n = 4), we use d2 = 2.079. The value of g is used in other parts of the calculation (such as computing averages or pooled variances), but not for selecting the d2 constant itself.
About the d2 Table Version:
You’re absolutely right again — the statistical constant d2 is based on well-established distribution properties and does not change over time. The “old” filename on the reference table might be misleading; the constants themselves remain accurate. I appreciate your observation and will look into making sure we reference the most clearly explained and current-looking materials for consistency and clarity.
Hi folks! Regarding the d2 lookup…
You need a d2 table that allows for more than one subgroup (that’s your ‘g’ value), or your calculation will be off. I used the d2 table from the Measurement Systems Analysis Reference Manual, Third Edition. If you don’t have a copy just lying around waiting to be consulted, there’s a PDF copy (I assume the company has permission to disseminate) at http://parsetraining.com/wp-content/uploads/2018/11/MSAmanual.pdf – Appendix C.
Alternatively, use the search term ‘d2 table subgroups’ in a search engine like Google and you’ll find a number of applicable tables that people have published. This one has rounded to three decimal places, which should be fine for the vast majority of calculations: https://andrewmilivojevich.com/d2-values-for-the-distribution-of-the-average-range/
Apologies for the misleading table link. I’ve amended that now.
Cheers,
Naomi
The d2 constant is a statistical value used in estimating standard deviations from average ranges, especially in Gage R&R studies. The value of d2 = 2.079 used in the example corresponds to a subgroup size of 4 , which refers to the number of repeated measurements (or trials) per part/operator combination.
It may not appear directly in some tables unless they’re fully expanded or specifically formatted by subgroup size.
To clarify the example:
I’ll work on making the link to the table and its usage in examples clearer in the article — your feedback is much appreciated!
What is the difference between Gauge R&R as a % of tolerance and Part to Part Variation
Hi Aman,
For more, see these articles by MiniTab;
can you please explain the constants like “k1” or other “d2” means how these are derived?
Hi Ibrar,
What is d2?
The d2 constant is a statistical factor used to estimate the standard deviation from the average range (R̄) of a sample. It is derived from the properties of the range distribution of a normal population. Each value of d2 corresponds to a specific sample (subgroup) size.
For example, if you have a subgroup of 4 measurements, then d2 = 2.079. The standard deviation (σ) is then approximated by:
σ ≈ R̄ / d2What is k1?
The constant k1 is derived directly from d2 and is used to estimate repeatability (Equipment Variation, EV). It simplifies the equation:
EV = R̄ × k1Where
k1 = 1 / d2for the specific subgroup size. So if d2 = 2.079, then k1 = 1 / 2.079 ≈ 0.4808.Are these values fixed?
Yes, these constants are mathematically derived from statistical distributions and are standard across the industry. They don’t change year to year, although presentation formats may vary between sources.
Could you please give a theoretical explanation for the AV computation in section 6 ?
Regards
Hi Al,
Theoretical Basis for AV (Appraiser Variation):
AV quantifies the variation due to differences in operator averages — in other words, how consistent operators are with each other in their mean measurements across multiple parts.
Here’s how it’s computed in the Average & Range method:
AV = x̄diff × k2Where:
k2 = 1 / d2for the appropriate configurationWhy do we use x̄diff?
By taking the range of the operator means, we’re measuring how far apart the operators’ results are from one another. This provides a simplified yet effective estimate of reproducibility.
And why multiply by k2?
The constant k2 scales the range into an estimate of standard deviation — similar to how we convert average range into standard deviation using
σ ≈ R̄ / d2. It’s a statistically derived adjustment based on the distribution of range for normal populations.Theoretical Justification:
The entire method is rooted in classical statistical theory, which shows that ranges (differences between max and min) of normally distributed values follow predictable distributions. The constants d2 (and thus k2) are derived from those expected distributions.
This method assumes random variation among operators and parts and works best in a balanced design. If assumptions are violated (e.g., non-normality or interactions), the ANOVA method is more appropriate.
You can learn more about AV here and here.
I’ll update that section of the article.
Best, Ted.
I have a set of data
k = 3
n = 5
r = 10
I calculated thru ANOVA, I get 80.2% GRR.
But when I calculated thru AVERAGES and RANGES, I get 27.7%
Please help figure out what I did wrong. Thanks!
Hi Richard,
It’s difficult to pinpoint without seeing all of your calculations. If I were to guess, it would be that perhaps you are trying to do a kind of R&R (there are 3 main types) that isn’t applicable to both the range and ANOVA method.
To my understanding, only the crossed R&R can be used in both cases. After that, there might be a minor math error. The answers would be different, but unlikely to be that far off.
Here’s a breakdown of why you could be seeing such a big difference:
The ANOVA method accounts for interaction effects (e.g., operator × part), while the Average & Range method does not. If there is significant interaction between appraisers and parts, the ANOVA method will pick it up and include it in the GRR — resulting in a higher percentage.
Check if your ANOVA output includes interaction terms. If the interaction is significant, ANOVA inflates the GRR. If not, use the “without interaction” values for a fairer comparison with the Average & Range method.
If the data set is unbalanced (not equal number of parts/operators/trials) or includes outliers, ANOVA is more sensitive to these factors. Double-check your dataset for consistency and normality.
Make sure the same data (parts × operators × trials) was used in both methods, and that subgroup sizes and calculations for d2 and constants like k1 and k2 were correct for the Average & Range method.
What You Can Do:
Best, Ted.
One thing that is super unclear to me is Gage R&R. I don’t think there is enough on the R&R page given how many questions are asked about it on the quizzes and reviews. For example, I had a question where I was given R-Bar and K1, but after reading Gage R&R and doing a page search for “k1” the only result was a comment telling us to refer to Naomi’s comment which covered D-tables. I’m still not really sure how to do it.
Hunter, We updated the article with a bit more exposition here. Does this help?
Gage R&R can definitely feel a bit opaque at first, especially when constants like
k1andd2show up without clear step-by-step context. You’re right that we could make this much clearer on the main page.To help in the meantime, here’s a quick explanation:
k1 is a constant derived from the
d2table and is used in this formula:EV (Repeatability) = R̄ × k1Where:
So, if your subgroup size is 4, the
d2value is 2.079, andk1 = 1 / 2.079 ≈ 0.4808.Hello Mr. Ted,
Is there a separate ATTRIBUTE GRR method using ANOVA???
Pl clarify…
Hi Arun,
Yes, there is. I’ve added a small section with a few helpful links above.
Best, Ted.
In the tables used for the example, please note that “trial” is spelled “trail”. Thank you.
Wow- there were certainly a lot of misspellings here. Appreciate the note! Fixed now.
Hello everyone, please note in the example above, everything works well until the calculation for RR. At that point, the RR value is treated as a percentage. If you go back to the figure above showing how to find percent %R&R the formula for RR and %R&R are not the same. In order to find %R&R, the total variation (TV), is needed. In order to find total variation, the part variation is needed. Part variation is best determined based on historical production data, but lacking that it can be estimated in the following way: PV=jR, where R is the range of the part averages and j, is dependent on the number of parts in the study. For the example above, the overall average of part x is 0.3075, y is 0.2875, and z is 0.2975. The R is then 0.02. j=5.15/d2 where k=1 and n=number of parts. (j=6/d2 might also be used) For this example, j=2.70. Part variation for this example is 0.054, which using the formulas above gives us a total variation of 0.055. Finally, if the analysis is continued, we will find %R&R= 20.4% which is very different than 1.12%. Putting the data into the crossed MSA option in Minitab will show that the measurement system is not acceptable. Regards to everyone, take care and be safe.
Thank you for your insightful observation regarding the calculation of Repeatability and Reproducibility (R&R) in Gage R&R studies. You’re absolutely correct that accurately determining %R&R requires a comprehensive understanding of total variation (TV), which encompasses both measurement system variability and part-to-part variation.
Clarifying the Calculation of %R&R
To compute %R&R accurately, it’s essential to consider the total variation, which is derived from both the measurement system variation (R&R) and the part variation (PV). The formula is as follows:
Total Variation (TV) = √(R&R² + PV²)
Where:
Once TV is determined, %R&R is calculated as:
%R&R = (R&R / TV) × 100%
This approach ensures that the measurement system’s variability is appropriately contextualized within the overall process variation.
Utilizing Minitab for Gage R&R Analysis
Software tools like Minitab can facilitate this analysis. By inputting your measurement data into Minitab’s Crossed Gage R&R study, the software will compute the necessary statistics, including %R&R, and provide visualizations to aid in interpreting the measurement system’s adequacy.
Ensuring precise calculations in measurement system analysis is crucial for maintaining quality and consistency in processes. Thank you for calling out these details!
Hello, my question is regarding the set up for the actual Gage R&R Study in regards to chemical manufacturing – example provided.
A plant makes hundreds of different types of batches/materials that use various gages to measure product specification. For example, say we’re interested in viscosity. When providing samples for the study, should the samples be comprised of different materials (which will have different average values for viscosity) OR should the samples be comprised of one material type, but different lots (different production dates, but should have the same average values for viscosity)?
Hello Brittany,
Gage repeatability and reproducibility (GR&R) is defined as the process used to evaluate a gauging instrument’s accuracy by ensuring its measurements are repeatable and reproducible.
• Repeatability: variability in repeated measurements when the same person measures the same item(s) repeatedly with the same instrument.
• Reproducibility: variability in repeated measurements when different people measure the same item(s) repeatedly with the same instrument.
It does not matter the same material or different material unless it provides the same values if the same person measures repeatedly or different people measure the same item repeatedly. Based on the scenario, we need to select crossed or nested Gage R&R.
For example, suppose the first sample is 1.2 Pa.S and another sample 2.3 Pa.S. It should give the same value if the same person measures repeatedly or different people measure the same item repeatedly.
But please note that when conducting GRR, assuming the specimens in the study do not change in physical properties that can affect the measurements over time.
Thanks
Hello,
While explaining the first step of the anova method you claim (3.05-3.066)^2 = .003. This seems to be a print error as It should be .0003 (.000256 rounded up). You also use .0003 later on in the image and cannot get the squared deviation sum to be .0033 with .003.
Thanks
Yes, Max. It is 0.0003 (.000256 rounded up), a print error. However, the calculation is correct as you indicated.
Thanks
This was a rally confusing article when it came to the math. The math does not add up especially when you try and do the AV portion with the numbers you have plugged in. I have done it multiple times/ways and it just doesn’t come out with your numbers.
Hello Ronald Adams,
We have included an excel template with detailed explanations and formulas in the article. Members can download it from our site.
Thanks
Your example of how to calculate Gage R&R using ANOVA is extremely confusing. The variable “MSTechnicianxPart” is used VERY liberally and appear multiple times with different values in your calculations. Additionally, the image uploaded for the ANOVA table is truncated on the first column. Would you be able to clarify the actual calculations and make it more clear which variables are being used?
I am working through a cleaner example on this page. Will be updated shortly.
He Ted. First Congratulations on a very clear and informative article. I had one query:
You have defined the F value for Tech as (MS Tech/MTech*Part ). Likewise for MS Part. Further the values obtained manually match the Minitab results.
I ran the ANOVA thru Excel 2 factor with replication successfully and all the SS and MS values matched. However the F values for Tech and Part did not match. The values obtained are from Excel are 0.831 and 215.44 for Tech and Part respectively. The F value for (Tech*Part) matches excel where the denominator used by you and Excel are the same – i.e. MSequipment. I checked various statistics texts* (see one below) and found that the denominator is supposed to be “The residuals” ( i.e. SS equipment in this case) for all three items – Parts, Tech and Parts*Tech. This is what Excel has used. I would be grateful if you can you give your comments on the above. Regards, Niraj Goyal
* F Value Definition: The F ratios are calculated by the Mean sum of squares of an entity and the mean sum of residuals squares.
Anova Two Factor with Replication [With Comparison] – upGrad
http://www.upgrad.com/blog/anova-two-factor-with-replication/
http://www.upgrad.com/blog/anova-two-factor-with-replication/
Hi Niraj Goyal,
The table is correct if you keep the interaction term in the model, as this article does. The F-values for the technician and part are determined by dividing by MSTechnician * Part, as shown in the table above. The F-value for the interaction term is determined by dividing by MSE, and Minitab follows the same approach.
If the interaction term is not significant and is removed from the model, the F-values for the technician and parts are determined by dividing by MSE. This is also how Minitab handles it. You can observe both scenarios in the Minitab table above.
Thanks
Hi,
Thanks for your reply.
My comments are referring to the Calculations for 2 factor ANOVA with replication i.e. interaction included.
As I understand it we first have to do ANOVA with replication as we do not know the p value of the Tech*Part Interaction i.e. is it is to be ignored or not.
The excel table using the 2 factor with replication is shown below.
ANOVA
Source of Variation SS df MS F P-value F crit
Parts 116.529 9 12.948 215.45 0 2.040
Tech 0.1 2 0.05 0.831 0.440 3.150
Parts*Tech 0.447 18 0.0248 0.4130 0.980 1.778
Error 3.606 60 0.0601
Total 120.68196 89
In this calculation the F values for parts and Tech are obtained by dividing by MSError and MSParts*Tech,
As per my understanding the calculations in your table in the article showing manual calculations uses 2 factor ANOVA with replication and should correspond to the Excel Table. Herein this therefore MSError should be used in the denominator.
The conclusion that p>.05 for Tech* part interaction and therefore it should be ignored is given below this table. If this is OK then we can go on to calculate in the next step the table without interaction.
Sorry to bug you. But it is in the interest of a clear understanding.
Rgds,
Niraj
Niraj,
Yes, you are technically correct: The initial F-tests for the ANOVA factors should all use the MS_Error (residual) as the denominator—not MS_Interaction.
I will update the article:
1) Correct any formulas that mistakenly use MS_Interaction as the denominator for F-tests.
2) Clarify that interaction must be evaluated first, then either retained or dropped depending on significance.
3) Ensure Excel and manual calculation examples align in logic and interpretation.
Hi,
Refer my earlier message. Unfortunately the Excel table was typed as a table but in acceptance the format was changed by your software into non tabular type.
Hope you are able to align the data into a table or else give me an email where I can drop my comments with the table reading as a table.
Rgds,
Niraj
No worries. I was able to understand it. Making corrections now.
Mr. Hessing,
Thank you very much for such clear and extensive article.
It was a great guide to me. I was working on a new Python package called pypetb for RnR análisis and this article was a big help checking its behaviour.
You’re very welcome, José!
Glad you got value out of it! Would love to hear more about your project.
Ted, it was great.
Question, what part tolerance has to do in GRR? adding tolerance is optional in GRR and it shows in the column next to %study Var. i don’t know how to interpret it. what is the benefit of % Tolerance (SV/Toler).
An auditor was asking for it and says why you didn’t add it in GRR!!
I said have it or not doesn’t make changes in study but he was pushing us to add it
Hello Ali,
The %Tolerance (SV/Toler) column in the Gauge R&R (GRR) study indicates the percentage of total variation attributable to the tolerance of parts being measured. A high %Tolerance value suggests that much of the measurement variability is due to the allowed tolerance range for the parts themselves, while a low value indicates that the measurement system contributes less to overall variability.
This metric helps in understanding the measurement system’s performance relative to part tolerances and guides decisions for improving accuracy and precision.
It provides insights into sources of variation, aiding in optimizing the measurement process and ensuring compliance with quality standards.
Thanks
I have question about entering the correct Upper and Lower Spec Limit for a Minitab calcuation for a variable Anova Crossed Gauge R&R. This is an automated system we are evaluating where it is designed to reject parts with a gap greater than 0.8mm. So it accepts 0.0mm to 0.8mm. But it can get parts with a 1.3mm gap, and of course it should reject them. I initially preparred samples from 0.2(smallest that can be reasonable made) to 1.3mm, and ran the Gage R&R entering LSL = 0 & USL = 0.8. The system capability “Total Gage R&R” was much higher than we typically allow. I realized that it is elevated because some of my parts are above USL. If I enter LSL = 0 & USL = 1.3 with the same data, then it reduces Total Gage R&R by 30%. Which is the correct LSL and USL to get an accurate result? I’m asking because we had SOP’s that require a maximum Total Gage R&R, but it doesn’t explicetely state if LSL & USL are for the limits on the part being measured or limits of the system that is measuring the part. Thank you for your advice and input.
Hello Brad,
If the goal is to assess the system’s capability to measure parts within specified tolerances, the Upper Specification Limit (USL) and Lower Specification Limit (LSL) should align with the part specifications, which, in this case, range from 0.0mm to 0.8mm for accepted parts. However, if the aim is to evaluate the system’s ability to handle all possible scenarios, including measurements beyond the specified limits, then the actual measurement range of the system should be considered, extending up to 1.3mm in this instance.
Therefore, please consult with relevant stakeholders to determine the most appropriate approach to ensure an accurate interpretation of results.
Thanks
What distinguishes the %Tolerance analysis from the %Total Variation analysis? Additionally, how can we determine which approach (TV or tolerance) to employ in our process?
Thanks in advance.
%Tolerance analysis and %Total Variation (TV) analysis are both used to assess process variations, but they focus on different aspects.
%Tolerance Analysis
%Total Variation Analysis
Choosing Between %Tolerance and %Total Variation Analysis
Ultimately, the choice depends on the specific goals of your analysis and the characteristics of the process in question.