What is Fault Tree Analysis
Fault Tree Analysis (FTA) is a graphical tool used to explore the causes of system-level failures. It uses Boolean logic to combine a series of lower-level events. It is basically a top-down approach to identify the component-level failures (basic events) that cause the system-level failures (top events). Fault tree analysis consists of “events” and “logic gates,” which connect the events to identify the cause of the top undesired event.
Fault Tree Analysis is easier than Failure Mode and Effects Analysis (FMEA) as it focuses on all possible system failures of an undesired top event. At the same time, FMEA conducts analysis to find all possible system failure modes irrespective of their severity.
History of Fault Tree Analysis
Fault Tree Analysis is a top-down approach originally developed in Bell laboratories by H. Watson and A. Mearns for the Air Force in 1962. This concept was later adopted by Boeing, and today, it is widely used in the aerospace, automobile, chemical, nuclear, and software industries, especially for reliability and safety events.
When Would You Use FTA
Fault Tree Analysis can be used to perform all types of system-level risk assessment processes. The purpose of FTA is to effectively identify the cause(s) of system failure and mitigate the risks before it occurs. This is an invaluable tool for complex systems that visually display the logical identification of the problem. Moreover, system efficiency can be attained by this analysis. It can be implemented alone or complement Failure Mode and Effects Analysis (FMEA).
FTA Symbols
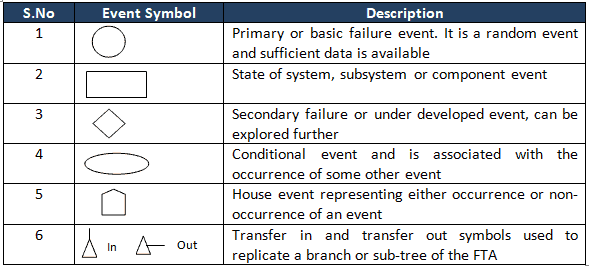
A Fault Tree uses logical gates to perform an analysis. There are numerous FTA symbols exist, but these are broadly divided into two categories: Event symbols and Gate symbols.
Event Symbols in FTA
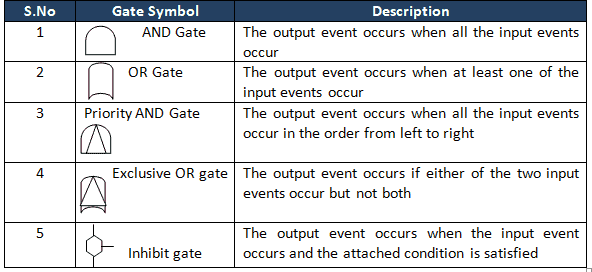
Gate Symbols in FTA
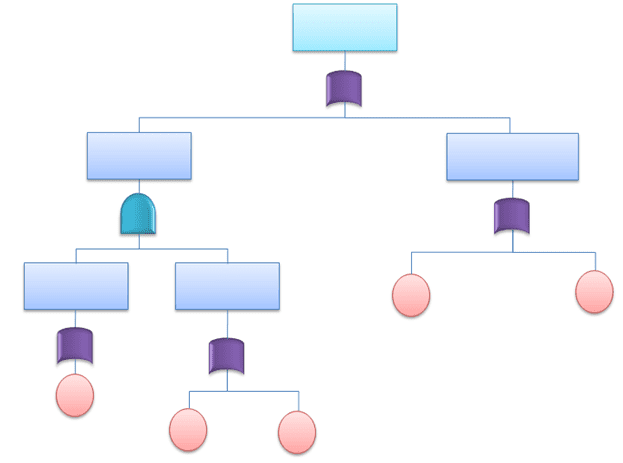
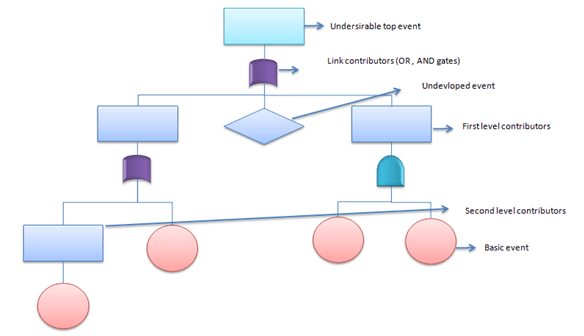
How do you do Fault Tree Analysis
- Define the primary failure to be analyzed. In other words, identify the undesirable top event.
- Identify first-level contributors who are just below the top level using the available technical information.
- Link these contributors to the top-level event using logical gates (AND, OR gates), and also see the relationship to help identify the appropriate logical gate.
- Identify the second-level contributors and link to the top by using logical gates.
- Identify the minimal cut set.
- Repeat the same steps till the basic causes,
- Finally, complete and evaluate the FTA.
- Calculate the probability of the lowest level element occurrence and also measure the probabilities from the bottom up.
Minimal Cut Sets
One of the important factors in the qualitative analysis of fault trees is to identify a minimal cut set. For instance, complex and large fault trees have to use superior tools (algorithms for extraction) to get the minimal cut sets.
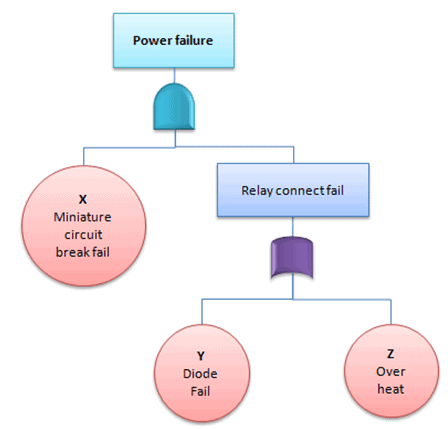
Cut set: A set of basic events that together cause the TOP undesirable event.
Ex: X, Y, and Z (from the below picture)
Minimal cut set: A cut set with a minimal number of events that can still cause the TOP undesirable event. In other words, the TOP undesirable event occurs if one or more minimal cut set occurs.
Ex: (X and Y); (X and Z) from the below picture
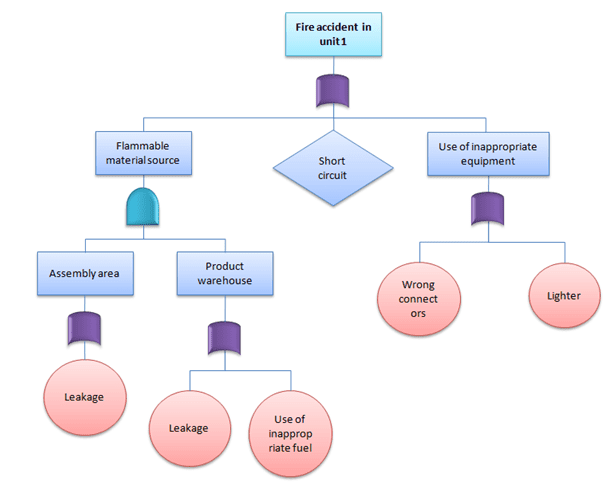
Practical Example of FTA
A fire broke out at unit 1 of XYZ cable manufacturing company despite the safety system in place. The General Manager was very concerned about the accident and requested the Safety Officer in charge to evaluate the system. However, as part of the initial analysis of the existing system, the safety team used FTA to identify the different causes of the accident.
Quantitative Fault Tree Analysis
The top undesirable event occurs if one or more of the minimal cut sets occurs. Hence, the main target is to identify minimal cut sets. Moreover, if all the minimal cuts are independent of each other, then we could compute the probability of the top undesirable event by:
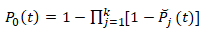
Where Pj is the failure probability of the minimal cut set.
Example: Find the probability of water pump failure from the below example.
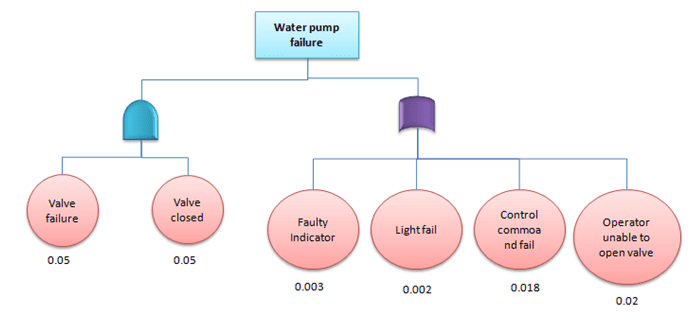
The water pump will fail because of value failure and value closed or fault indicator or light failure control command failure or operator unable to open the valve, since OR gates add and AND gates multiply the probability of pump failure.
μpumpfail =1 – [(1 – (0.05 * 0.05)) * (1 – 0.003) * (1 – 0.002) * (1 – 0.018) * (1 – 0.02)] = 0.0448
Hence, the probability of water pump failure = 4.48%
Advantages of Fault Tree Analysis
- The fault tree visually depicts the analysis that will help the team to work on the cause of an event in a logical way that leads to failure.
- Highlights the critical components related to system failure.
- Provides an efficient method to analyze the system.
- Unlike other analysis methods, human errors are also included in the analysis.
- It helps to prioritize the action items to solve the problem.
- Provides qualitative and quantitative analysis.
Disadvantages of Fault Tree Analysis
- Too many gates and events to be considered for large system analysis.
- The basic disadvantage is that it examines only one top event.
- Common cause failures are not always obvious.
- Difficult to capture time-related and other delay factors.
- Needs experienced individuals to understand the logical gates.

Comments (26)
Thank you very much Sir for your explanation of FTA. God Bless you!
I am an Afghanistani Student in France doing my MSc. thesis on quantitative risk management techniques. This lectures helped me to understand the technique more wisely.
I’m glad it helped, Yama! You’re very welcome.
4. Liquefied Natural Gas (LNG) has become the fuel of choice in the past decade due to its
clean burning characteristics. Global consumption reached 2600 billion cubic meters per
year in 2003 and continues growing at an annual rate of 1.8%. In order to meet the rapid
growth of global demand for natural gas, especially for use as fuel for power generation
in modern combined-cycle gas turbine plants, a new LNG plant (Liquefaction facilities
or process trains) must be designed to meet a number of challenges, including demand for
lager train capacity, cost reduction strategies, technology improvement, and operational
flexibility and efficiency. With the advancements of process, technical, and capacity, the
safety and reliability of the operation must be taken into consideration very seriously. The
increasing complexity in highly technological systems and operations is leading to
potentially disastrous failure modes and new kind of safety issues. Therefore, a
comprehensive and systematic safety assessment is vital for an LNG facility in order to
prevent future accident.
As a part of safety and risk management, the abnormal event data in the LNG facility are
gathered and recorded every day. Table 1 lists the abnormal event scenarios and severity
level of their consequences for a particular month in one LNG facility. Using the SHIPP
methodology, perform the following tasks.
1) Develop the event tree diagram to depict consequences associated with each safety barrier.
Thus, estimate the consequences occurrences probability of each severity level. The
additional needed is Failure probabilities of release prevention, dispersion prevention,
ignition prevention and escalation prevention are given as 0.0326, 0.0411, 0.101 and
0.0121, respectively
Hi EBEHITA,
We won’t solve your homework problems for you but I’m happy to help if you have a specific question about a concept.
Best, Ted.
Thanks for this wonderful Work done. Helped me lot for my current Capstone Project.
Warm Regards
ROHIT 🙂
That’s great to hear, Rohit! You’re very welcome.
I’d love to learn more about your capstone project!
Hi Ted,
The steps above list to ‘Calculate probability of lowest level elements occurrence and also measure the probabilities from bottom up’.
Just wondering how you go about this or have missed a step already stated?
Thanks.
Hi Paul,
Does the example below the instructions help make it more clear?
Best, Ted.
What is the difference between WHY-WHY Analysis & Fault tree analysis.
Hi Kanak,
A Why-why analysis is commonly referred to as a 5 whys analysis.
They are completely different. So much so that this sounds like a homework question, which we do not solve for students.
If not and you’re genuinely curious I’d ask you to look at our 5 whys article here. The methods and desired outcomes are completely different. If you have a specific question, I’m happy to help.
Best, Ted.
It’s the tool to identify the root cause and to prevent the occurrence
Please i will like to know the year and date of this article for referencing purposes.
Thank you.
Hi Matilda,
I first published this article on May 14th, 2014. It’s been revisited and revised many times since then.
Best, Ted.
Hello
Thank you for your good lecture.
I have 2 question about Exclusive OR Gate.
1. does Exclusive OR Gate mean that JUST one of the basic event happen?
2.how do we calculate the probability of Exclusive OR Gate?
Mohammad,
You should read through my page on probability here.
Best, Ted.
Hello Ted,
My name is Gideon, an M.Sc student in Energy Economics. I am writing a thesis on the Assessment of Implementation Risks of a renewable energy technology. I would like you to recommend a good risk management process that aligns with my thesis. Thank you.
Have you explored a FMEA?
Hello Ted,
I’d like to ask, is there a way to calculate the probabilities of the basic events in a theoretical manner? (Without already having any numbers for them) I’m currently creating a fault tree which has no data of the failure rates of the components i’m talking about, so I’m not sure how to proceed.
Many thanks.
Well, I think you can, but you’re going to have to ascribe a variable to each.
Nice and useful presentation. Thank you sir.
One doubt.
How to find the values of fuel (solid 2%, liquid 9%, gas 10%) and ignition.
Who will find this value, and how?
Please let me know.
The percentages you mention—2% for solid fuel, 9% for liquid, and 10% for gas could be used in Fault Tree Analysis (FTA) as probabilities representing the likelihood that a particular fuel type is present under certain conditions. These values are not universal constants; rather, they are derived from a combination of industry data, historical incident records, expert judgment, and probabilistic modeling.
Who Determines These Values?
These values are usually determined by professionals such as:
How Are These Values Found?
The process generally involves:
For example, if 9% of incidents involving a specific machinery type over a 10-year period involved liquid fuel, that number might be adopted in a fault tree as a representative likelihood.
Why didnt we multiply by 1-0.05*0.05 instead of 0.05*0.05 As the formula said 1- Product(1-P_j) in the example?
Yes, Haroun
Please see below detail explanation
Two events with an AND gate: P(event1) = 0.05, P(event2) = 0.05
Four events with OR gates: P(event3) = 0.003, P(event4) = 0.002, P(event5) = 0.018, P(event6) = 0.02
To calculate the probability of the pump failure, we need to consider the logical gates correctly:
P(pump failure) = 1 – [(1 – (P(event1) * P(event2))) * (1 – P(event3)) * (1 – P(event4)) * (1 – P(event5)) * (1 – P(event6))]
Plugging in the given probabilities:
P(pump failure) = 1 – [(1 – (0.05 * 0.05)) * (1 – 0.003) * (1 – 0.002) * (1 – 0.018) * (1 – 0.02)]
Calculating the expression:
P(pump failure) = 1 – [(1 – 0.0025) * (1 – 0.003) * (1 – 0.002) * (1 – 0.018) * (1 – 0.02)]
P(pump failure) ≈ 0.0448
Therefore, the correct calculated probability of pump failure is approximately 0.0448 or 4.48%.
Great Article. Thank you.
Very welcome, Harish!
You’re welcome, Harish! Thank you for the kind words!
-Ted.