Contingency tables are a kind of table in a matrix format that displays the frequency distribution of the variables. In other words, contingency tables are a 2-way classification table containing frequencies of how often things appear and can be used to determine if 2 variables are independent or are significantly associated.
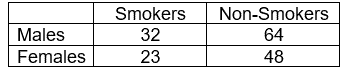
Example: Surveying two categorical variables like male and female and another two categorical variables like smokers and non-smokers to determine what proportion of males are smokers.
For instance, the above example is the simplest kind of contingency table., A table in which each variable has only two levels; this is called a 2 x 2 contingency table. However, in principle, any number of rows and columns may be used. There may also be more than two variables, but higher order contingency tables are difficult to represent on paper.
Furthermore, the significance of the difference between the two proportions can be assessed with a variety of statistical tests. Especially, Pearson’s chi-squared test, the G-test, Fisher’s exact test, and Barnard’s tests. In addition, it provides the entries in the table represent individuals randomly sampled from the population about which we want to draw a conclusion.
Why Contingency Tables
Contingency tables provide the basic picture of interrelation between two or more variables and also can help to find the interaction between them. The table shows the distribution of one categorical variable in rows and another categorical variable in columns. These tables are widely being used in engineering, research and agriculture.
A row X column contingency table depict the observed frequency of the two variables, the interaction of r X c of a contingency table is a cell. Moreover, contingency tables are very similar to goodness-of-fit tests.
If the proportions of individuals in the different columns vary significantly between rows (or vice versa), we say that there is a contingency between the two variables. If there is no contingency, we say that the two variables are independent. In other words, the two variables are not independent.
Assumptions
- Variable must be nominal or categorical
- Category of variables are mutually exclusive
- The sampling method to be a simple random sampling
- The data in the contingency table are frequencies or count
Distributions of Contingency Table
A contingency table can summarize three probability distributions.
- Joint distribution
- Marginal distribution
- Conditional distribution
For example, contingency table for the study of the student’s gender and handedness
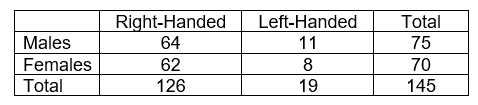
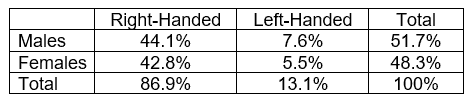
Create relative frequency contingency table: Convert the count into corresponding percentage values.
Percentage value for cell 1 = Count value in a cell/Grand total *100=64/145*100
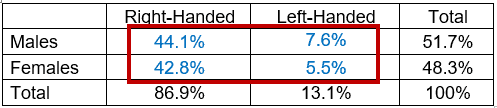
- Joint distribution: The joint distribution is the percentage corresponding to each combination of categorical variables.
From the above example, male right-handed, female right-handed, male left-handed, and female left-handed.
- Marginal distribution: In the marginal distribution, percentages have calculated from the margins of the total row and column of the table. In other words, the totals of row and column of contingency table provide the marginal distribution.
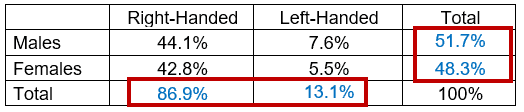
For the above example 51.7% are male, and 48.3% are female regardless of handedness. These are marginal distributions of gender. Similarly, 86.9% are right-handed and 13.1% are left-handed regardless of gender. These are marginal distributions of handedness.
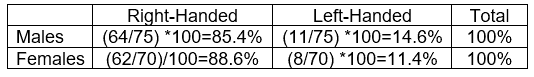
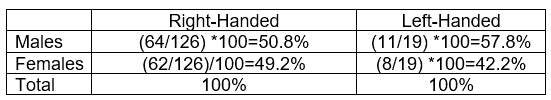
- Conditional distribution: The conditional distribution focuses on specific categories rather than the whole sample. The conditional distribution provides more insight into the data. It tells us how categories are distributed.
Similarly,
Chi-Square Tests
Usually, the data set that we are using is a sample of the population, and to infer the trends about the population will need to use a statistical method. While, for contingency tables, chi square test can be used to make such inferences. Moreover, the Chi-Square will test whether there is a dependency between the two classifications.
Since the actuals measured may not agree with the theoretical values predicted you can use the Chi Square calculation to make the determination. Additionally, a correlation coefficient can be calculated.
The formula for expected and observed frequencies of chi-square, X2 is
- If X2 value is zero, it means that the theoretical and observed frequencies agrees exactly.
- If X2 value greater than zero, that means they do not agree exactly. The more the X2 value, the more the discrepancy between theoretical and observed frequencies
Steps to perform Chi Square test
Step1: Define the null hypothesis and alternative hypothesis
- Null hypothesis (H0): There is no association between two categorical variables
- Alternative hypothesis (H1): There is a significant association between two categorical variables
Step2: Specify the level of significance
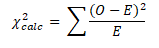
Step 3: Compute χ2 statistic

- O is the observed frequency
- E is the expected frequency
Expected frequency for each cell = (frequency of columns*frequency of rows)/ n
Step 4: Calculate the degree of freedom= (number of rows -)*(number of columns -1)= (r-1) * (c-1)
Step5: Find the critical value, based on degrees of freedom
Step 6: Finally, draw the statistical conclusion: If the test statistic value is greater than the critical value, reject the null hypothesis, and hence we can conclude that there is a significant association between two categorical variables.
Contingency Tables Example
Example: A middle school is holding a carnival, and they want to know which flavor of ice cream they need to serve. Hence, they conducted a random sample of the study. Below is the contingency table for the same. At 95% confidence level, a researcher wants to know if the ice cream flavor depends on gender?
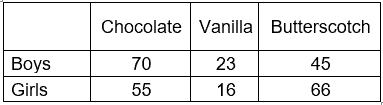
- Null hypothesis (H0): There is no association between gender and Ice cream flavor.
- Alternative hypothesis (H1): There is a significant association between gender and Ice cream flavor.
Level of significance: α=0.05
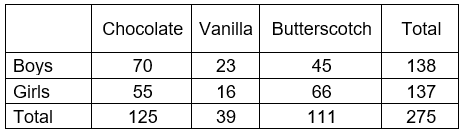
First calculate the expected frequency
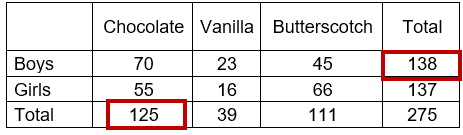
For the cell (Boys, Chocolate) = (125*138)/275 = 120
Similarly, calculate the expected frequency of all cells
Expected frequency
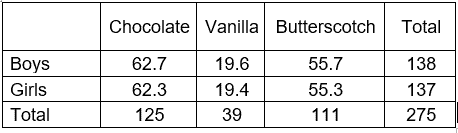
Compute χ2 test
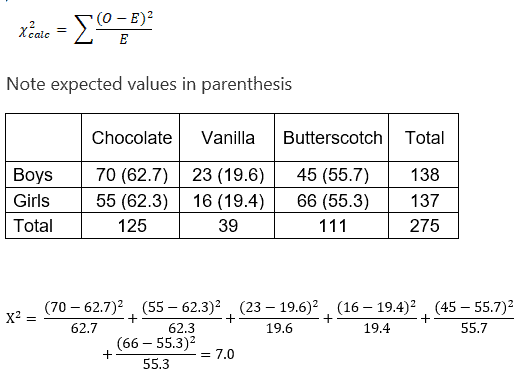
Degrees of freedom = (r-1)*(c-1) = (2-1)*(3-1) =2
Chi-square critical value for 2 degrees of freedom =5.991
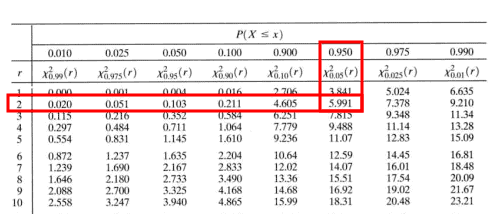
The test statistic value is greater than the critical value, hence we can reject the null hypothesis
So, we can conclude that there is a significant association between gender and Ice cream flavor.
Contingency Tables Videos
Six Sigma Black Belt Certification Contingency Table Questions:
Question: The following contingency table is using in an organization.
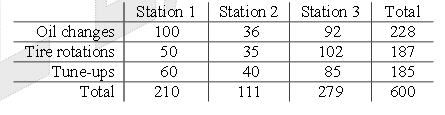
On the basis of this information, what is the expected number of oil changes for Station 1 ?
(A) 70
(B) 76
(C) 80
(D) 100
Answer:
80. This is a contingency table question. Lots of numbers in this table. However, most of them are useless. Just take the two categories that we need and multiply. Then divide by the all totals.
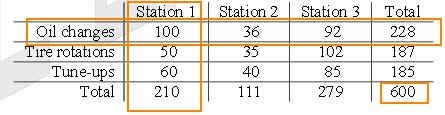
So, the expected number of oil changes = all of station 1 * all oil changes / All totals = 210 * 228 / 600 = 80.
