One sample Z hypothesis test is one of the basic tests of inferential statistics. One sample Z test is a parametric procedure for hypothesis testing. It tests whether the sample mean is significantly different (greater than, less than or not equal) than a population mean when the population’s standard deviation is known. Since we use standard normal distribution to compute the critical values, we often call it a one sample Z test.
When to use one sample Z test
One sample Z test is a robust hypothesis test for violations of standard normal distribution. Z test is similar to student t-test, z test is basically used for relatively large samples (say n>30) and the population standard deviation is known. Whereas, student t-test is for a small sample size, and also t-test assumes the population standard deviation is unknown.
Assumptions of one sample Z hypothesis test
- Population data is continuous
- Population follows a standard normal distribution
- The mean and standard deviation of the population is known
- Samples are independent of each other
- The sample should be randomly selected from the population
One sample Z-test Formula

- x̅ = sample mean
- µ= population mean
- σ= population standard deviation
- n= sample size
Steps to Calculate One Sample Z hypothesis test
- Select appropriate statistic- one-tailed or two-tailed?
- Determine the null hypothesis and alternative hypothesis
- Determine the level of significance
- Find the critical value
- Calculate the test statistics

- Where
- x̅ is observed sample mean
- μ is population mean
- σ is population standard deviation
- n is sample size
- Then make a decision, reject the null hypothesis; If the test statistic falls in the critical region.
- Finally, interpret the decision in the context of the original claim.
Hypothesis Testing
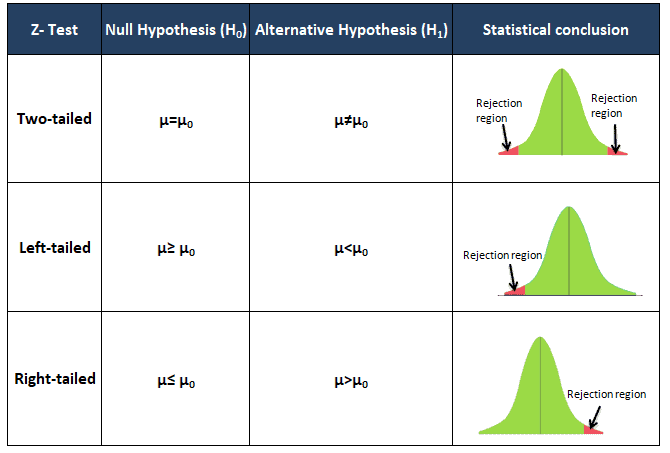
A tailed hypothesis is an assumption about a population parameter. The assumption may or may not be true. One-tailed hypothesis is a test of hypothesis where the area of rejection is only in one direction. Whereas two-tailed, the area of rejection is in two directions. The selection of one or two-tailed tests depends upon the problem.
One Sample z test mostly performed in Analyze phase of DMAIC to check the sample mean is significantly different than a population mean when the population’s standard deviation is known.
Example of right-tailed test
Example: A coaching institute claims that the students’ mean scores in their institute are greater than the 82 marks with a standard deviation of 20. A sample of 81 students is selected, and the mean score is 90 marks. At 95% confidence level, is there enough evidence to support the claim?
- State the null and alternative hypothesis
- Null hypothesis H0: µ ≤ 82
- Alternative hypothesis H1 : µ>82
- Select appropriate statistic- Since the claim is student marks are greater than 82 marks; it is a right-tailed test.
- Level of significance: α= 0.05
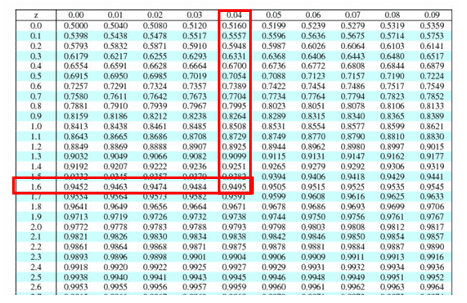
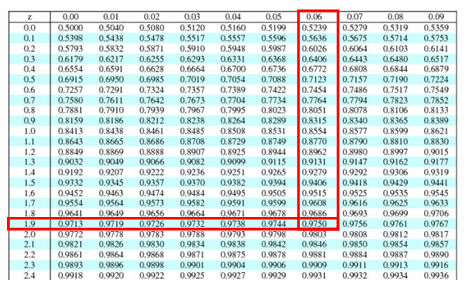
- Find the critical value: 1-α= 1-0.05=0.95
- Look at the 0.95 in z table= 1.645
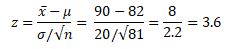
- Calculate the test statistics
- x̅ =90
- μ=82
- σ =20
- n =81
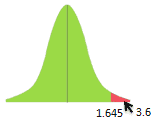
Interpret the results: Compare Z calc to Z critical . In hypothesis testing, a critical value is a point on the test distribution compares to the test statistic to determine whether to reject the null hypothesis. Since zcal value is greater than z critical value and it is in the rejection region. Hence we can reject the null hypothesis.
There is enough evidence to support the students’ scores in their institute is greater than the 82 marks.
One Sample Z Excel Right Tail template
Example of left-tailed test
Example: An online grocery shop claims that the mean delivery time is less than 120 minutes with a standard deviation of 30 minutes. A random sample of 49 orders is delivered with a mean of 100 minutes. At 95% confidence level, is there enough evidence to support the claim?
- State the null and alternative hypothesis
- Null hypothesis H0: µ ≥ 120
- Alternative hypothesis H1 : µ<120
- Select appropriate statistic- Since the claim indicates delivery time is less than 120 minutes, it is a left-tailed test.
- Level of significance: α= 0.05
- Find the critical value: 1-α= 1-0.05=0.95
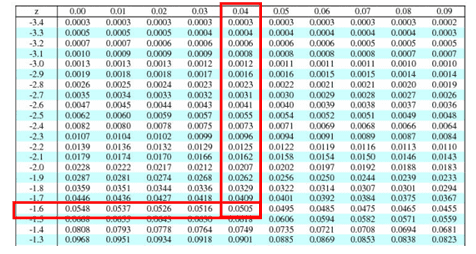
- Look at the 0.95 in z table= -1.645
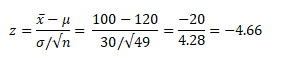
- Calculate the test statistics
- x̅ =100
- μ=120
- σ =30
- n =49
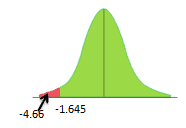
Interpret the results: Compare Z calc to Z critical . In hypothesis testing, a critical value is a point on the test distribution compares to the test statistic to determine whether to reject the null hypothesis. Since zcal value is less than z critical value and it is in the rejection region. Hence we can reject the null hypothesis.
There is enough evidence to support the claim the mean delivery time is less than 120 minutes.
One Sample Z Excel Left Tail template
Example of two-tailed test
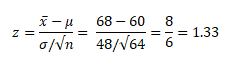
Example: The mean weight of the rubber gasket is 60 grams with a standard deviation of 48. Furthermore, A researcher thinks that material X will have a significant impact on the weight of a gasket. A random sample of 64 gaskets collected and the mean weight is 68 grams. At 95% confidence level test the material X had an effect.
- State the null and alternative hypothesis
- Null hypothesis H0: µ = 60
- Alternative hypothesis H1 : µ≠60
- Since it is a two tailed test α/2= 0.05/2=0.025
- Find the critical value: 1-α/2= 1-0.025=0.975
- Then, look at the 0.975 in z table= ±1.96
- Calculate the test statistics
- x̅ =68
- μ =60
- σ =48
- n =64
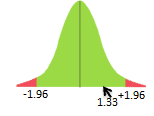
Interpret the results: Compare Z calc to Z critical . In hypothesis testing, a critical value is a point on the test distribution compares to the test statistic to determine whether to reject the null hypothesis. Since zcal value is not in the rejection region. Hence, we fail to reject the null hypothesis. We can say the mean weight of the gasket is 60.
One Sample Z Excel Two Tail template
Helpful Videos
https://www.youtube.com/watch?v=FU9UR9XVZwc
https://www.youtube.com/watch?v=aiRVUkM92os
When you’re ready, there are a few ways I can help:
First, join 30,000+ other Six Sigma professionals by subscribing to my email newsletter. A short read every Monday to start your work week off correctly. Always free.
—
If you’re looking to pass your Six Sigma Green Belt or Black Belt exams, I’d recommend starting with my affordable study guide:
1)→ 🟢Pass Your Six Sigma Green Belt
2)→ ⚫Pass Your Six Sigma Black Belt
You’ve spent so much effort learning Lean Six Sigma. Why leave passing your certification exam up to chance? This comprehensive study guide offers 1,000+ exam-like questions for Green Belts (2,000+ for Black Belts) with full answer walkthroughs, access to instructors, detailed study material, and more.
