We can use many Process Performance Metrics to measure our processes’ current and future value.
Before we look at the metrics, let’s review some of the terms we’ll use. It’s important that you understand these terms as they’re used in Six Sigma.
Terminology
- Defect: An end result (often a product) that doesn’t fall within a pre-defined acceptable range of values. These values might be a physical product’s strength and/or size measurements. For a service, these values might be KPIs like turnaround time. Generally, a defect is a failure to meet customer quality expectations.
- Opportunity: A chance to add value for a customer. This applies to any situation in which your company can improve the perceived value of a product or service. For example, if you’re manufacturing a product to customer specifications, your opportunities might be:
- Matching customer’s physical requirements
- Meeting deadlines
- Providing a free courier service straight to the customer.
- Unit: A tangible result to a customer: a single service or product. For example, a customer’s phone call to your service department is a unit.
- Yield: The yield is the percentage of opportunities that were successfully met. Another way to look at yield is the percentage of defect-free processes.
Yield = (Opportunities - Defects) / Opportunities
Opportunity vs. Unit
It’s easy to get opportunities and units mixed up. The simplest way to differentiate them is to consider customer needs and requirements.
The item they need is the unit.
The specifications for that item (color, size, materials, time to delivery) are the opportunities.
You might have several opportunities per unit. For example, think about a customer calling a service line to get help with a piece of software. The unit, in this case, is the phone call. The opportunities could be:
- Answering the phone call within an acceptable time range.
- Having the phone call directed to an appropriate person.
- Being able to help the customer with their problem.
- Leaving the customer with a positive experience.
Process Performance Metrics – Defects per Opportunity (DPO)
DPO stands for Defects per Opportunity. This is a simple ratio. Take the number of defects you have in your process (usually found by sampling) and divide it by however many opportunities there are. Then, express the ratio as a percentage.
DPO = Defects / Opportunities
Complex processes and items often have many opportunities to add value. Hence, you might have several defects per process or item.
Example: A fast food drive-through order. The customer has a lot of criteria on which they’ll judge the experience as a whole:
- Staff attitude
- Speed of service
- Accuracy (do the received items match the order?)
- Presentation
- Taste of the food
- Freshness/heat of the food.
Each of these criteria is an opportunity to add value for the customer. A failure in any of these criteria detracts from value and counts as a defect. If the customer has to wait ten minutes (defect in the speed of service), receives the wrong burger (defect in accuracy), and their burger is lukewarm (defect in freshness/heat), three defects have each detracted value from the end result.
Potential gotcha: Ensure you use the same population’s defects and opportunities. For example, if you’re counting defects in a sample of 500 products, the number of opportunities must also apply only to that sample of 500 products.
Examples of Defects Per Opportunity
Let’s say Joe’s Burgers serves 1,000 customers a day. The company has identified its opportunity types as follows:
- Accuracy
- Speed
- Freshness
- Taste
For example, in a single day, 50 customers were given the wrong order, 75 felt they waited too long, 25 said their order was cold, and 50 more said their burgers just tasted bad.
Some of that feedback might have overlapped; customers might have received the wrong order and waited too long for it. That doesn’t matter for this metric because each order has multiple opportunities attached to it.
To calculate the number of opportunities, multiply the number of orders (1000) by the number of opportunity types (4) to get 4000.
DPO = number of defects / number of opportunities = 200/4000 = 0.05 = 5%
Process Performance Metrics – Defects per Unit (DPU)
Defects per unit is a similar calculation to DPO, but instead of looking at opportunities, we’re looking at units. See Opportunity vs. Unit above if you’re getting confused.
Let’s look at the Joe’s Burgers example again, but this time from a DPU viewpoint.
Examples of Defects Per Unit
Let’s say Joe’s Burgers serves 1,000 customers a day. In a single day, 50 customers had the wrong order, 75 felt they waited too long, 25 said their order was cold, and 50 more said their burgers just tasted bad.
Some of that feedback might have overlapped; customers might have received the wrong order and waited too long for it. That doesn’t matter for this metric. We’re just looking for a basic ratio.
(Note: it would matter if we discussed defective units per 1000, for example.)
The number of units is the number of orders (1000).
DPU = number of defects / number of units
DPU = 200/1000 = 0.2
DPU = 20%
Process Performance Metrics – Defects per Million Opportunities (DPMO)
DPMO is based on DPO, but it uses real-world manufacturing-type numbers. This is an important metric because it’s used in Six Sigma to measure the performance of a process. For example, Joe’s Burgers would use DPMO to determine how successful their current serving process is and how it compares to other serving processes they might have tried.
Defects per Million Opportunities are typically extrapolated from a sample. In the work examples above, we looked at Joe’s Burgers using a single day’s orders as a sample–1000 units. If you’ve already worked out DPO for a sample, you can calculate DPMO by simply multiplying the decimal result (not the percentage) by one million.
DPMO = DPO * 1000000
Alternatively, you can use this equation:
DPMO = (Defects / Opportunities) * 1000000
Or:
DPMO = (Defects / (sample size * opportunities per unit)) *
1000000
Worked example of Defects Per Million Opportunities
Joe’s Burgers serves 1,000 customers in a day. The company has identified its opportunity types as follows:
- Accuracy
- Speed
- Freshness
- Taste.
In a single day, 50 customers had the wrong order, 75 felt they waited too long, 25 said their order was cold, and 50 more said their burgers just tasted bad.
Number of defects: 50 + 75 + 25 + 50 = 200
Sample size: 1000
Opportunities per unit: 4
DPMO = (Defects / (sample size * opportunities per unit)) *
1000000
DPMO = (200/(1000 * 4)) * 1000000
DPMO = 50000
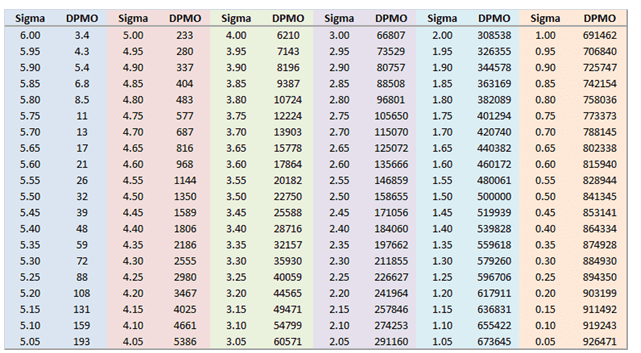
How to Calculate 6 Sigma level based on DPMO
There are two basic ways that you can determine the Six Sigma level from your DPMO figure:
- Look at an appendix table.
- Use the equation.
Six Sigma Level Equation
Use this equation to calculate your process’s Six Sigma Level based on its DPMO:
Level = 0.8406 + √(29.37 – (2.221 * ln(DPMO)))
Note: If you’re wondering where the numbers 0.8406, 29.37, and 2.221 come from, they are constants that help us calculate the DMPO or level.
Process Sigma = 0.8406 + SQRT(29.37 – 2.221 * (ln(DPMO))).
Reference: Breyfogle, F., 1999. Implementing Six Sigma: Smarter Solutions Using Statistical Methods. 2nd ed. John Wiley & Sons.
Worked example of calculating Six Sigma Level
Let’s start with the DPMO figure from Joe’s Burgers: 50000.
Firstly, if you haven’t come across ln before, it means that you need to find the natural logarithm of the number–in this case, the DPMO. Use a scientific calculator. In this case, the natural logarithm of 50000 to 4 decimal places is 10.8198.
Secondly, we need to plug that into the equation:
Level = 0.8406 + √(29.37 – (2.221 * ln(50000)))
Level = 0.8406 + √(29.37 – (2.221 * 10.8198))
Level = 0.8406 + √(29.37 - 24.0307)
Level = 0.8406 + √(29.37 - 24.0307)
Level = 0.8406 + √5.3392
Level = 0.8406 + 2.3106
Level = 3.1513
First-Time Yield (FTY)
First-time yield is the most common way to calculate the process yield. It is the number of defect-free units coming out of a process compared to the number of units manufactured. In other words, it is the probability of a defect-free output from a process.
FTY does not capture how many defects are reworked in each stage. In other words, It doesn’t include units that must be reworked into defect-free units. It will not detect the effect of hidden factors.
FTY is the number of goods produced divided by the total number of parts going into the process.
How to calculate FTY for a process
- Calculate the first-time yield for each step in the process based on the number of defect-free units going into each step (typically, each step will have fewer units than the preceding step).
- Multiply the FTYs together to get the total first-pass yield.
FTYt = FTY1 * FTY2 * FTY3 * ... * FTYn
Where:
FTYtis the total First Time Yield for the process.nis the number of steps in the process.
Worked example of calculating FTY
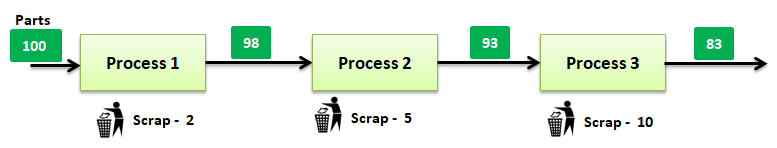
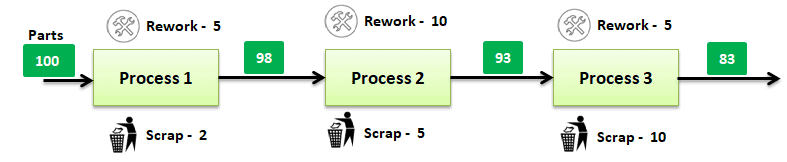
Example: In a manufacturing plant, 100 parts are entered into the first process, two are scrapped, and 98 defect-free parts go to the next stage. Five of the 98 parts that enter the second process are scrapped, and 93 defect-free parts go to the next stage. Ten of the 93 parts that enter the third process are scrapped, and 83 defect-free parts go to the next stage. Find the First time yield.
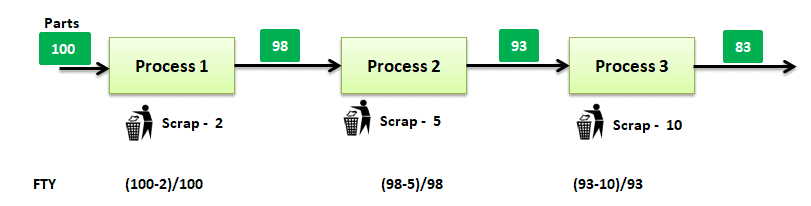
- First process: 100 parts enter into process; 2 scrapped, So output 98 parts; FTY1 = (100 – 2)/100 =98/100= 0.98
- Second process: 98 parts enter into process; 5 scrapped, So output 93 parts; FTY2 = (98 – 5)/98 =93/98= 0.9489
- Third process: 93 parts enter into process; 10 scrapped, So output 83 parts; FTY3 = (93 – 10)/93 =83/93= 0.8924
Total First Time Yield = 0.98*0.9489*0.8924= 0.829 ~ 83% yield
FTY also can calculate the final number of defect-free parts divided by the number of parts at the start of the process = 83/100 = 83%
Rolled Throughput Yield (RTY)
Rolled Throughput Yield (RTY) is a great way to see a process’s health. RTY provides a probability that a process with no defects will generate a unit. In other words, it’s the probability that a multi-step process will produce a defect-free unit.
Rolled Throughput Yield is more powerful as it is sensitive to defects. Instead of being based on the yield on units, it uses the number of defects at each step (even if the defective part is corrected, it will still count in the calculation of RTY). It is valuable to the organizations as most of them consider only the successful/passed units, although inherent Muda is present. RTY considers total defects in the entire process.
Before calculating RTY, you need to complete two important steps:
- Map the process so that you know how many steps it has.
- Take samples at each stage of the process and test for defects so that you have data for the calculation.
Example
A sequence of 3 operations has first-pass yield (right first time) rates as follows:
- 1st step: 93%
- 2nd step: 87%
- 3rd step: 92%.
In other words, the first step in a process has a 93% chance of completing correctly. The 2nd has only an 87% chance. And the third process step has a 92% chance.
The first pass yield rate for the whole process is the chance of each step multiplied.
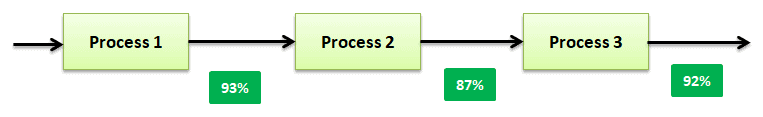
RTY = 93% * 87% * 92% = 74%
Each step by itself had a good chance of being accepted. But when you take a look at the entire system, you see that the cumulative errors take a toll. In the above example, any item that the process produced only had a 74% chance of passing through without error or rework.
Worked example of calculating Rolled Throughput Yield
Example: In a manufacturing plant, 100 parts are entered into the first process, two are scrapped, and five are reworked to get the 98 parts to the next stage. The 98 parts enter into the second process, where five are scrapped and ten are reworked to obtain 93 parts. Ninety-three parts enter into the third process, where ten are scrapped and five are reworked to get 83 parts. Find the Rolled throughput yield.
- First process: 100 parts enter into process; 2 scrapped and 5 reworked, So output 98 parts; RTY1 = (100 – (2+5))/100 =93/100= 0.93
- Second process: 98 parts enter into process; 5 scrapped and 10 reworked, So output 93 parts; RTY2 = (98 – (5+10))/98 =83/98= 0.85
- Third process: 93 parts enter into process; 10 scrapped and 5 reworked, So output 83 parts; RTY3 = (93 – (10+5))/93 =78/93= 0.84
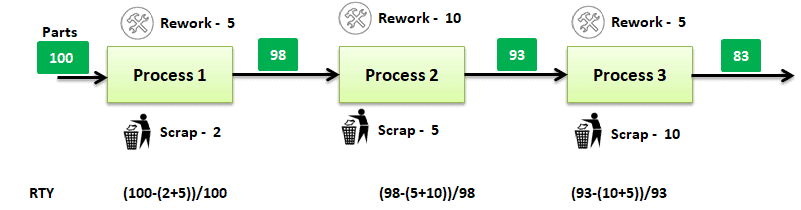
So, the Total Rolled Throughput Yield = 0.93*0.85*0.84= 0.664 ~ 66% yield
Calculating DPU from Rolled Throughput Yield
In addition to the Defects Per Unit calculations above, you can use a process’s RTY to calculate its Defects Per Unit. Use this equation:
DPU = -ln(RTY)
Reminder: ln is the natural log.
Worked example of calculating DPU from RTY
From the above manufacturing example, RTY is approximately 69.5%. Then, to get the DPU, we plug that into the equation:
DPU = -ln(0.695)
DPU = 0.3638
Using Process Performance Metrics
Once you understand the Process Performance Metrics available and how to use them, the next step is to decide which metrics to use.
Primary vs. Secondary Process Performance Metrics
Primary and secondary metrics aren’t static. Each organization will have its priorities regarding Process Performance Metrics, leading to different lists of primary and secondary metrics. These lists will occasionally change as an organization’s focus and business objectives change.
Generally speaking, primary process performance metrics are the ones your organization decides to focus on most. The rest are secondary process performance metrics.
Questions to Ask When Designing Your Process Performance Metrics Program
The following information was emailed to me and attributed to Will Poats of the CEB.
Accounting and Reporting teams are always looking to include the most relevant metrics in their management reports, so they should avoid the three following missteps when incorporating metrics: wrong metric selection, lack of process ownership, and ineffective reporting practices.
Below are 13 questions you can ask yourself and your team members when designing or strengthening your metrics program.
- Have we chosen no more than 12 to 15 metrics for decision making among those suggested by the corporate finance leadership team and business partners?
- Do we agree on the definition for each metric, the reason for tracking it, and the target we are aiming for?
- Can we link each metric back to a business or corporate goal?
- Have we tested the metrics with our stakeholders to ensure they understand the definition and have a clear sense of how they will use the metric to make decisions?
- Check whether we incorporated both qualitative and quantitative metrics into our decision-making framework?
- Do we know which drill-down options are most useful for each metric?
- Also, do we know which styles of metrics presentation each stakeholder prefers?
- Have we run each metric during a trial period to establish a baseline?
- Check whether we agreed on refresh triggers or cycles for each metric to prevent them from becoming obsolete?
- Do we have a metric that can predict future problems?
- Have business partners feel comfortable alerting Finance when metrics need to change and adapt to the new environment?
- Do we eliminate old metrics when new ones become more representative?
- Finally, Do we update our business partners on metrics we will no longer be tracking when the dashboard changes?
Six Sigma Black Belt Certification Process Performance Questions:
Question: Which of the following performance measures is most appropriate for evaluating the tangible effects of a Six Sigma project? (Taken from ASQ sample Black Belt exam.)
a) Cycle time
b) Team member absentee rate
C) Employee morale
D) Unsolicited compliments from customers
Answer:
Question: Which of the following is the correct formula for DPMO?
(A) D/TOP
(B) DPO X 1,000,000
(C) D X U XOP
(D) DPU/DPO
Answer:
ASQ Six Sigma Green Belt Process Performance Questions
Question: Which of the following measures is used to show the ratio of defects to units?
(A) DPU
(B) DPO
(C) DPMO
(D) PPM
Answer:
When you’re ready, there are a few ways I can help:
First, join 30,000+ other Six Sigma professionals by subscribing to my email newsletter. A short read every Monday to start your work week off correctly. Always free.
—
If you’re looking to pass your Six Sigma Green Belt or Black Belt exams, I’d recommend starting with my affordable study guide:
1)→ 🟢Pass Your Six Sigma Green Belt
2)→ ⚫Pass Your Six Sigma Black Belt
You’ve spent so much effort learning Lean Six Sigma. Why leave passing your certification exam up to chance? This comprehensive study guide offers 1,000+ exam-like questions for Green Belts (2,000+ for Black Belts) with full answer walkthroughs, access to instructors, detailed study material, and more.

Comments (31)
The DPMO for a process is 860. What is the approximate 6sigma level of the process?
a. 4.2 b. 4.4 c 4.6 d 4.6
860 dpmo is sigma level 4.64 – you can get this by using sigma calculator or reference tables or you can use MS Excel formula ‘NORMSINV(1 – (DPMO/1000000))+1.5 in Excel to find the sigma level of the process. NORMSINV() refers to the probability value (yield) in the Z distribution table to arrive at the sigma level based on the probability of the yield.
Why have you added 1.5 in the formula?
Sorry, Divyansh. Which formula?
Divyansh, I think + 1.5 is representing 1.5 sigma shift over time.
In your explanation of DPO, should the number of opportunities be 5,000 instead of 1,000 as there are 5 opportunities for a defect in each of the 1000 units?
Good eye, Joe, but no. I’ll admit this example is a bad one. The key here is the wording ‘mutually exclusive.’ See the description for DPU for some disambiguation. I’ll update the example to something a bit clearer.
This unit was a great introduction to the math that will be coming. The examples were easy to follow and the explanation of what the different measures tell you were simple and to the point. A great confidence builder for what is ahead.
Thanks, Charles. I’m glad it was helpful!!
Re: Question #19: XYZ company paying $2 per form and there are 30 fields in each form. Customer reported 1,600 defects in the 6,000 forms filled by the supplier. Calculate the DPMO and process sigma level.
I understand how we can lookup the DPMO using the chart you provided, but will this table be on the exam?
And I can only assume we will be allowed to use a scientific calculator (embedded in the online test) in order to derive the DPMO via log calculation?
Different exams have different stipulations. For example, some exams allow you to bring your own reference material while others do not. Some allow for scientific calculators, while others do not.
DPMO is a simple division. Looking up Sigma level is usually done by chart. It would be unreasonable for organizations to ask you to memorize the chart (however, do enough practice questions and you’ll get close!), so for the exams that provide reference sheets they will have that material or not ask you the question. For the exams that let you bring your own material, I would certainly add this to your must-have references.
Hi Ted,
Trust you are doing well,
I would like to thank you for your guidance and support to help us learn and properly understand the material of lean six sigma,
Moreover, I would like to ask you with regards to the worked example of calculating Rolled Throughput Yield
Let’s go back to Joe’s Burgers. They have 1000 customers in a day – 1000 instances of the food delivery process. We can break their process down into four steps:
Take the order.
Make the ordered items.
Assemble the order.
Take payment and deliver the order.
Now, we said that in the day we’re using as our sample data, they received the following complaints:
50 customers had the wrong order (problem in step 1)
75 felt they waited too long (problem in step 4)
25 said their order was cold (problem in step 3)
50 said their burgers just tasted bad (problem in step 2)
My understanding is that I need to follow the sequence of processes and multiply the defect free % in each step as per the following:
RTY= ((1000-50)/1000) * ((950-50)/950) * ((900-25)/900) *((875-75)/875)*100
Hence, can you please clarify why the problem was resolved by multiplying the defect free for every sequence starting from 1000 as initial input for every sequence?
Good observation, Mayssa. You’re essentially asking what is the difference between First Pass Yield and Rolled Throughput Yield.
I really should clean this part up so it’s more clear. I fear that I was too ambitious putting all of this on one page. I’ll try to disambiguate with help from this article on the same.
RTY
FPY
Does that help?
Hello Mr. TED,
Thank you very much for your explanation.
Talking about RTY and FPY, they are a little bit tricky for me. When we talk about RTY, do we consider that all the parts will continue all the processes even though they are defective (scrap or rework) ? If it’s not the case, wouldn’t it be incorrect to calculate the middle processes yields while taking in consideration the total number of parts ?
The same for FPY, do we consider that all the defective parts (rework or scrap) would be taken from the process thus we would only produce free-defects parts ? If it’s not the case, wouldn’t it be incorrectto devide the defective parts by only the number of free-defects parts ?
I hope that you got my point.
Thank you in advance for your consideration.
Kind Regards.
Hello Anass Knidil,
You are saying defective (Scrap or rework), but scrap and rework are two different aspects, rework items may come back into the process, whereas scrap items will completely move away from the system.
Let’s see one more example here for better clarity
Example: A manufacturing process with 3 steps – Processes 1, 2, and 3. Let’s also say that on a particular day they note the following performance:
Process 1: 100 parts passed through this process and 84 “good” parts left this process (scrapped 16).
Process 2: With some WIP laying around 110 parts passed through this process with 82 “good” parts passing (28 scrapped)
Process 3: With even more WIP laying around this process they managed to produce 138 parts with 126 parts passing (12 scrapped).
Process 1 had a daily yield of 84% (84/100) while process 2 had a daily yield of 75% (82/110) and finally process 3 had a daily yield of 91% (126/138).
So, to calculate RTY we simply multiply these yields together giving us a composite yield for the day. Doing this gives us: 84% x 75% x 91% = 57%
For FPY, it is the probability of a defect-free output from a process.
When a process has a high total throughput yield and a low rolled throughput yield, it’s a sign that large amounts of rework are being performed. This rework is waste that adds cost and negatively affects delivery rates.
Thanks
Hi Ted excellent way of explaining, just have one confusion what is the difference between RTY (Rolled throughput yield) and FPYt (Total First-Pass-Yield) it seems both are same
Hi Ehsan,
I’ve got this earmarked for a future improvement alongside CBA vs ROI.
In the meantime, there’s good coverage here.
Hi Ted,
I found the phrasing “first pass yield (right first time) ” is very misleading.
since when we are calculating FPY, we include the units passed with re-work, those units are not done correclty at “the first time”, otherwise it won’t need rework.
Best,
Xiang Liu
Hi Xiang,
Thank you for the note. The reason I state ‘right the 1st time’ is because first pass yield does not include units passed with rework. Only good units with no rework or repairs are counted as coming out of an individual process.
Best, Ted
I just wanted to inform you in case you weren’t aware, but the video right under the DPMO section has been removed by the original uploader, so we no longer have access to it.
Otherwise, this is very helpful.
Thanks for the feedback, Tyler.
I’ve removed that video. We’ll look for a replacement shortly.
Glad it’s been helpful!
BTW: The last example for RTY is wrong. 98-(5+10)/98 = 0.85 not 0.89.
“So, the Total Rolled Throughput Yield = 0.93*0.89*0.84= 0.695 ~ 70% yield” should be “So, the Total Rolled Throughput Yield = 0.93*0.85*0.84= 0.660 ~ 66%”
Good catch, Alan.
Updated!
Hi Ted,
wish you could help. if I have 3 weekly DPU data (0.01, 0.02, and 0.03) . The weekly production volume is 5000 units. and the defect opportunities per process flow = 20
How can I get the DPMO ?
thank you in advance
Great question! To calculate DPMO (Defects Per Million Opportunities) from DPU (Defects Per Unit), production volume, and the number of opportunities per unit, follow these steps:
Given:
Step 1: Calculate the Average DPU
Average DPU = (0.01 + 0.02 + 0.03) / 3 = 0.02
Step 2: Use the DPMO Formula
DPMO = (DPU × 1,000,000) / Opportunities per unit
DPMO = (0.02 × 1,000,000) / 20 = 20,000 / 20 = 1,000 DPMO
So, the DPMO for this process is 1,000.
Additionally, if you’re interested in preparing for your certification, consider our comprehensive courses:
This unit was EXTREMELY helpful! It really made everything I’ve been studying in the ASQ Handbooks and other reference material finally click! Thank you so much!
So glad to hear that, Audrey!
“Note: If you’re wondering where the numbers 0.8406, 29.37 and 2.221 come from, they are constants that help us calculate the DMPO or level simply.”
Will we be required to memorize these constants? I also wondered if we are authorized to use Microsoft Excel during the IASSC Green Belt exam? I have no clue how to calculate the natural logarithm of a number and know I can easily use the LN function in Excel. Therefore, that’s the reason I ask.
Very Respectfully,
Travis
Hi Travis,
For most exams you will not be required to memorize these constants. If you are taking an exam that allows reference materials, like the ASQ, I’d suggest having it bookmarked though.
I do NOT know of any exam that allows you to use excel however logarithm functionality is available on the standard calculators that the exams allow. Speaking of calculators, be sure to double check with your exam provider that the calculator you want to bring to the exam is on their acceptable list.
Best, Ted
Hi TED, Firstly thank you for your articles.
I have doubt Can we consider PPM as process metrics ?
Hi Neelam,
I would consider PPM, or Parts per Million, to be a unit of measure rather than a standalone metric.
Can you add some more context?
Best, Ted.