Viewing 2 reply threads
  • Author
    Posts
    • #14866
      rodney javier ramirez teran
      Participant

      Six Sigma Study Guide Alumni

      Hi Ted, please help me

      Why the critical probability p is calculated in this form?

      with the rest I have no problem

      best
      javier R.
      Attachments:
      You must be logged in to view attached files.
    • #14869
      Alex Johnston
      Moderator
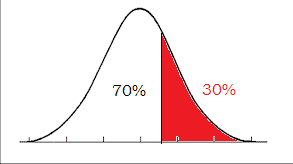
      I believe your confusion here stems from the difference in looking for a p value from 1 tail vs 2 tails. As you can see in the below illustration, we are only looking for the right side 30% that live longer than 30 days. Because we are only looking at one side, there is not a need to divide by two.
      So we get a Z value for p= .7 of 0.524. From there we can use algebra in the Z= (x-Mu)/SD to get a standard deviation of 8.

      Attachments:
      You must be logged in to view attached files.
    • #14949
      rodney javier ramirez teran
      Participant

      Six Sigma Study Guide Alumni

      I can not see the image, I could send it in another format please, Thanks Alex

Viewing 2 reply threads
  • You must be logged in to reply to this topic.