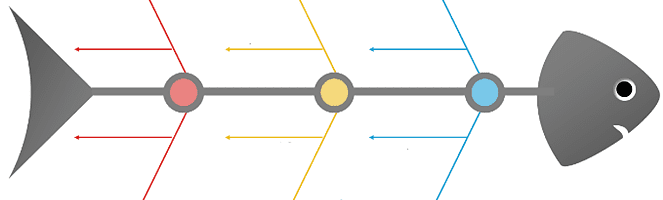
Cause and Effect Diagram (aka Ishikawa, Fishbone)
A Cause and Effect Diagram (aka Ishikawa, Fishbone) showing possible causes (process inputs) for a given effect (process outputs).
Copy and paste this URL into your WordPress site to embed
Copy and paste this code into your site to embed