SIPOC

What is a SIPOC?

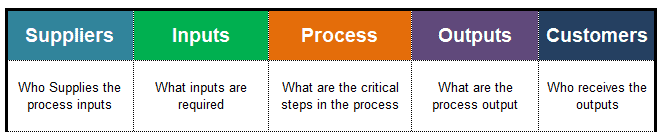
A SIPOC is a high-level process mapping tool that helps visualize a process and its influences. In other words, it is a useful tool that depicts how a process serves the customer and shows the inputs and outputs of a process in a visual format. 

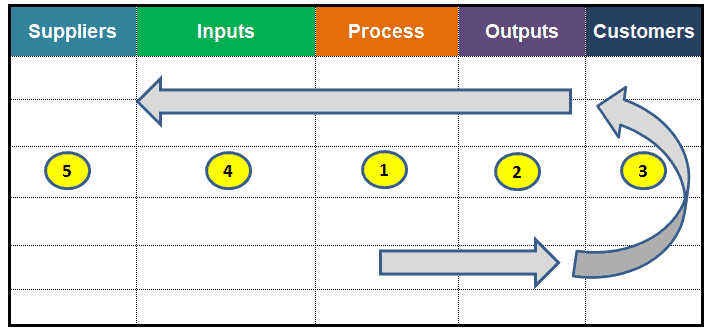
The acronym for SIPOC stands for Supplier, Input, Process, Output, and Customer. However, the construction of SIPOC has always involved identifying the process, determining the output of the process, recognizing the customer receiving the outputs, finding the inputs, and then finding suppliers of the inputs. So, often, it is called a POCIS diagram.

SIPOC

When Do You Use It?

Creating SIPOC is very helpful to continuous improvement projects like Six Sigma. Moreover, internal inputs and processes are usually accessible for a DMAIC team to access in the define phase. Hence, SIPOC is often used in the Define phase of DMAIC.

Additionally, SIPOC is very useful when part of the process is unclear. SIPOC helps teams, top management, and stakeholders resolve process-related issues and plan appropriate improvement strategies.

Why Use a SIPOC?

SIPOC is one of the primary factors for process improvement. Moreover, the diagram helps the team and the sponsor agree on the project boundary and scope. SIPOCs also help determine the variation in Key Process Input Variables (KVIPs) and Key Process Output Variables (KPOVs), which can significantly impact manufacturability and serviceability reliability, and product efficiency.

How to create a SIPOC?

SIPOC is a table that documents the process, output, customer, input, and supplier in a table format with the help of the following steps

  • Identify the process: Identify the process for which SIPOC will be created. Identify the process as a team.
  • Define the process steps: A process is a defined sequence of activities that usually adds value to inputs to produce customer outputs. High-level process flow covers a maximum of 7 steps; otherwise, it is hard to follow. Use an Affinity Diagram to reduce larger processes to a few key steps.
  • List the Outputs: Outputs are the products, services, and/or information that are valuable to the customers. This includes products, materials, or services delivered to the customer.
  • Identify the Customers: Customers are the users of the outputs produced by the process. Moreover, customers are not always outside the organization; they may also be internal stakeholders.
  • Determine the Inputs required for the process: Inputs define the material, service, and/or information used to produce the outputs. An input plays a vital role, as input variation impacts the output.
  • Identify the Suppliers: Suppliers provide inputs to the process. Not only external suppliers. You should also cover internal suppliers.
  • Validate the diagram: Once completed, share it with all relevant stakeholders and validate it before moving to the process improvement stage.

Benefits

  • It helps to define the new process.
  • Provides a project overview for all the stakeholders.
  • Provides a high-level project overview to the top management.
  • Problem-solving initiative.
  • Provides input and output information for critical processes.
  • Ensures all the stakeholders are on the same page.

Example SIPOC in a DMAIC Project

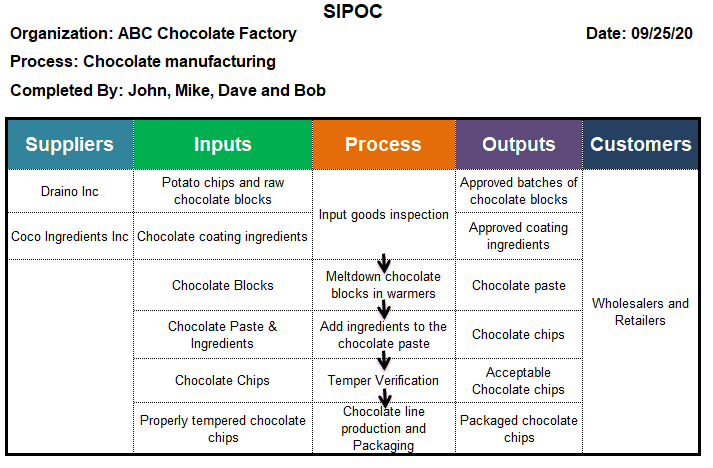
Example: The ABC chocolate factory in Houston is working to improve its operating processes using Six Sigma. During the Define phase, the team attempts to develop a SIPOC to understand how the chocolate manufacturing process serves the customer. They want to summarize this information and present the inputs and outputs of a process in a visual format.

  • Identify the process: The chocolate manufacturing process.
  • Define the process steps: The following is the high-level process
    • Input goods inspection
    • Meltdown chocolate blocks in warmers
    • Add ingredients to the chocolate paste
    • Temper verification
    • Chocolate line production and packing
  • List down the Outputs: The following are the outputs at various stages
    • Approved batches of chocolate blocks and Ingredients
    • Chocolate paste
    • Chocolate chips
    • Acceptable chocolate chips
    • Packaged chocolate chips
  • Identify the Customers: Wholesalers and Retailers.
  • Determine the Inputs required for the process: The following are the inputs required at various stages of operations.
    • Potato chips and raw chocolate blocks
    • Coating ingredients
    • Blocks
    • Chocolate Paste & Ingredients
    • Chocolate Chips
    • Properly tempered chocolate chips
  • Identify the Suppliers: The following are the suppliers – Draino Inc and Coco Ingredients Inc provide inputs for the manufacturing unit.
  • Validate diagram: Finally, Validate it with relevant stakeholders within the organization.

Important Videos

https://asq.org/quality-resources/sipoc

SIPOC Excel Template Download

Unlock Additional Members-only Content!

To unlock additional content, please upgrade now to a full membership.
Upgrade to a Full Membership
If you are a member, you can log in here.

When you’re ready, there are a few ways I can help:

First, join 12,000+ other Six Sigma professionals by subscribing to my email newsletter. A short read every Monday to start your work week off correctly. Always free.

* * *

If you’re looking to pass your Six Sigma Green Belt or Black Belt exams, I’d recommend starting with my affordable study guide:

1)→ 🟢Pass Your Six Sigma Green Belt: a study guide organized by the exam Body of Knowledge, 1,000+ practice questions with detailed answer explanations, and 15+ full-length mock exams

2)→ ⚫Pass Your Six Sigma Black Belt: the full Black Belt Body of Knowledge, 2,000+ practice questions with detailed answer explanations, and 15+ full-length mock exams

You’ve spent so much effort learning Lean Six Sigma. Why leave passing your certification exam up to chance? This comprehensive study guide offers 1,000+ exam-like questions for Green Belts (2,000+ for Black Belts) with full answer walkthroughs, access to instructors, detailed study material, and more.

​ Thousands have used this system to prepare. Join them here. 

Six Sigma Yellow Belt Training Guide

You want to learn Six Sigma properly, not just memorize answers. Maybe your company is starting an improvement project and you’ve been asked to join the team. Maybe you want a Yellow Belt and have never studied Six Sigma before.

So I’m building a course for exactly that. It’s called the Six Sigma Yellow Belt Training Guide, and this is the waitlist.

How it works. You start with a short diagnostic, so you know where you stand before lesson one. Then you work through 31 lessons in five modules. Each lesson ends with a practice quiz, and many include a hands-on spreadsheet lab. Each module ends with a gate. Pass it and you move on.

What it covers.

  • Foundations: quality, variation, DMAIC and who does what on a project
  • Defining a project: customers, CTQs, SIPOC, process maps and the charter
  • Finding causes: Pareto charts, fishbone diagrams, 5 Whys, waste, 5S and FMEA
  • Measuring: defect metrics, yield, cost of poor quality, basic statistics and measurement systems
  • Holding the gains: corrective action, poka-yoke, kanban, control plans and control charts

Why it helps. Three running projects follow you through the course: a healthcare clinic, an online store and a manufacturer. You watch each one move from charter to control, so every tool shows up where it’s used on a real project. It’s built to the ASQ and IASSC Yellow Belt Bodies of Knowledge, and the last module bridges to your exam, including the extra topics ILSSI covers.

If you already know the material and only want exam practice, the Yellow Belt study guide is the better fit.

When. The Training Guide is coming this fall. Join the waitlist below and I’ll email you when it opens.

Ted

TSF #53: Which Six Sigma Tool for Which Problem? A Simple Decision Guide

One of the fastest ways to lose points on a Six Sigma exam, and time on a real project, is reaching for the wrong tool. Six Sigma tool selection is the skill that prevents that, and it rarely gets taught directly. You know the tool. You have not built a fast way to match tool to situation.

In this post, I will walk you through a simple decision guide for the tools that get confused most often, so you can:

  • Stop hesitating between similar-sounding tools
  • Answer scenario questions faster on the exam
  • Pick the right starting point on a real project

FMEA vs. root cause analysis

Use FMEA when you are being proactive: you have not had a failure yet, and you want to rank potential failure modes before they happen. Use root cause analysis (fishbone, 5 Whys) when you are being reactive: a specific problem has already occurred and you need to find out why.

If the question describes a failure that already happened, root cause tools are almost always the right first move, not FMEA.

Control charts vs. hypothesis tests

Control charts answer “is this process stable and predictable over time.” Hypothesis tests answer “is there a real difference between two specific things” (two machines, before and after a change, two shifts).

If the scenario is about monitoring an ongoing process, think control chart. If it is about comparing two specific conditions, think hypothesis test.

DOE vs. simple hypothesis testing

Reach for a hypothesis test when you are comparing outcomes from one or two factors you already suspect matter. Reach for Design of Experiments (DOE) when you have multiple factors and you do not know which ones matter, or how they interact with each other.

DOE questions on exams often signal themselves with phrases like “multiple factors” or “interaction effects.” A single-factor comparison rarely needs a full DOE.

SIPOC vs. process map

Use a SIPOC when you need a high-level, one-page view of a process for a team that has not agreed on scope yet. Use a detailed process map once scope is agreed and you need to see every step, decision point, and handoff.

5 Whys vs. fishbone diagram

Both tools investigate a problem that already happened, so the choice between them is about complexity, not timing. Reach for 5 Whys when a problem seems to have one dominant, traceable cause and you can keep asking “why” down a single line of reasoning. Reach for a fishbone diagram when a problem likely has several contributing categories at once (people, process, equipment, materials) and you need to branch out and compare candidate causes side by side rather than follow one thread.

Pareto chart vs. histogram

Both are basic charts, but they answer different questions. A Pareto chart ranks categories of a problem (types of defects, causes of delay) by frequency, so you can see which few categories account for most of the impact. A histogram shows the distribution of a single continuous measurement (cycle times, part dimensions), so you can see the shape, spread, and center of your data. A Pareto chart is just a sorted bar chart with a cumulative line added, nothing more exotic than that, which is worth remembering when a question tries to make it sound complicated. If the scenario is about “which category matters most,” think Pareto. If it is about “how is this measurement distributed,” think histogram.

Check sheet vs. data collection plan

A check sheet is a simple tool for tallying how often something occurs while you watch a process directly. A data collection plan is the broader document defining what you will measure, how, how often, and by whom, often before you have even built a check sheet. Exam questions about a specific tally form usually point to a check sheet. Questions about planning measurement before data collection starts usually point to the data collection plan itself.

When two tools both seem to fit

Occasionally a scenario question supports two reasonable tools. When that happens, look for the word that signals timing: “before it happens” points toward proactive tools like FMEA, while “already occurred” or “has been happening” points toward reactive tools like root cause analysis. That single distinction resolves more apparent ties than any other detail in the question.

Build your own Six Sigma tool selection cheat sheet

Take the four pairs above and write your own one-line trigger phrase for each: the specific words or situations that tell you which tool to reach for. That one page will do more for your exam-day speed than re-reading tool definitions.

Six Sigma tool selection questions show up constantly on both ASQ and IASSC exams. If jargon is still tripping you up before you even get to tool selection, start here.

One more habit worth building alongside your cheat sheet: whenever you get a Six Sigma tool selection question wrong on a practice exam, do not just note the correct tool. Write down the specific word or phrase in the question that should have pointed you there. Over a few dozen practice questions, that running list becomes a far sharper trigger-word reference than any generic decision guide, because it is built entirely from your own blind spots instead of someone else’s.

Your next step

Build a one-page tool decision sheet this week using the pairs above, in your own words.

If you want practice choosing the right tool under exam conditions, the study guide plans include practice questions, mock exams and detailed explanations.

Then leave a comment and tell me:

  • Which pair of tools has confused you the most, and
  • Whether this cleared it up.

I read these, and your answers help me decide what to cover next.

Best, Ted.

“The content is too in depth which helped me to clear my doubts related concepts of hypothesis. Would like recommend to use this website thanks Ted.”

Mahender Singh K., LinkedIn Recommendation

When you’re ready, there are a few ways I can help:

First, join 12,000+ other Six Sigma professionals by subscribing to my email newsletter. A short read every Monday to start your work week off correctly. Always free.

* * *

If you’re looking to pass your Six Sigma Green Belt or Black Belt exams, I’d recommend starting with my affordable study guide:

1)→ 🟢Pass Your Six Sigma Green Belt: a study guide organized by the exam Body of Knowledge, 1,000+ practice questions with detailed answer explanations, and 15+ full-length mock exams

2)→ ⚫Pass Your Six Sigma Black Belt: the full Black Belt Body of Knowledge, 2,000+ practice questions with detailed answer explanations, and 15+ full-length mock exams

You’ve spent so much effort learning Lean Six Sigma. Why leave passing your certification exam up to chance? This comprehensive study guide offers 1,000+ exam-like questions for Green Belts (2,000+ for Black Belts) with full answer walkthroughs, access to instructors, detailed study material, and more.

​ Thousands have used this system to prepare. Join them here. 

Six Sigma Tools: The Complete List by DMAIC Phase

If you’ve studied for a Six Sigma exam, you’ve met dozens of Six Sigma tools: FMEA, Pareto charts, Control Plans, Fishbone diagrams. Each one is taught on its own page, with its own formula or procedure. What’s harder to find is one place that shows all the major tools at once. Better still, organized by where they get used in a project. That’s what this page is for.

Six Sigma tools are the specific techniques, templates, and statistical methods a project team uses to move through DMAIC (Define, Measure, Analyze, Improve, Control). DMAIC is the problem-solving framework at the center of every Six Sigma project. Some tools are purely qualitative. For example, a Fishbone diagram is just a structured conversation. Others, like a hypothesis test, are rigorously statistical. Most projects use a mix of both. Below, the major Six Sigma tools are grouped by DMAIC phase. After that come the cross-cutting Lean tools and the classic “7 tools” sets that appear on every certification exam.

Two things trip people up when they first look at a list like this. First, not every tool belongs to exactly one phase. For instance, Process Mapping often gets redone in Measure and again in Improve. Similarly, Control Charts can baseline a process in Measure and sustain it in Control. So the groupings below show where each tool is most commonly introduced. They are not a hard rule. Second, more tools doesn’t mean a better project. The best Black Belts pick the smallest set of tools that answers the question in front of them. They don’t force every tool into one project to prove they know it.

Define Phase Tools

The Define phase establishes what problem you’re actually solving, for whom, and why it matters. These tools get the team, the sponsor, and the customer agreeing on one problem. That happens before anyone collects data. Rushing this phase is a common reason projects stall. A team that disagrees on scope in week one will usually discover it in week six, after a lot of wasted analysis.

  • Project Charter: the foundational document for the project. It states the business case, problem, goal, scope, and team roles. It’s the first thing a Belt builds. It stays the reference point for the whole project.
  • SIPOC: a high-level process map showing Suppliers, Inputs, Process, Outputs, and Customers. It’s the fastest way to establish process boundaries before diving into detailed mapping.
  • Voice of Customer (VOC): the structured process of capturing what customers need. Teams use surveys, interviews, complaints, or observation, then translate the needs into measurable requirements.
  • Critical to Quality Tree (CTQ): translates a broad customer need into specific, measurable quality requirements a process must hit.
  • Critical to Cost (CTC): the same translation exercise as a CTQ tree, focused specifically on the cost drivers a customer or business cares about.
  • Critical to Safety (CTS): identifies the safety requirements a process or product must meet. It’s often used alongside CTQ in regulated industries.
  • Stakeholder Analysis: identifies everyone who influences or is affected by the project. It also maps how to manage and communicate with each one.
  • Communications Plan: formalizes who needs what information, how often, and through which channel, for the life of the project.

Measure Phase Tools

The Measure phase establishes a factual baseline for how the process performs today. It comes before anyone proposes a fix. This is also where a surprising amount of project time gets spent, not on fancy analysis, but on making sure the data being collected is trustworthy in the first place. A Measurement Systems Analysis that gets skipped here tends to quietly undermine every statistical conclusion drawn later.

  • Data Collection Plan: specifies what data will be collected, how, by whom, and how often. Writing it first saves the team from reworking a messy dataset later.
  • Check Sheet: a simple form for tallying data by hand where it occurs. It’s often the first data-collection tool a team builds.
  • Process Mapping: a visual, step-by-step diagram of how work actually flows through a process today, as opposed to how it’s assumed to flow.
  • Histogram: a bar chart showing how often different value ranges occur. It’s the fastest way to see a process’s shape, center, and spread.
  • Pareto Chart: a bar chart ranking causes by frequency or impact. It’s built on the 80/20 rule: a few causes usually drive most of the problem.
  • Box Plots: a compact summary of a dataset’s median, quartiles, and outliers. It’s especially useful for comparing several groups side by side.
  • Measurement Systems Analysis (MSA): verifies that the measurement system itself can be trusted. That covers the gauge, the method, and the people measuring.
  • Gage R&R: a specific MSA study. It splits measurement variation into the gauge itself (repeatability) and the people using it (reproducibility).
  • Control Charts: time-ordered plots that separate normal variation from special-cause variation. The special causes are the ones worth investigating. See also the specific chart types: I-MR, XmR, and EWMA.
  • Process Capability (Cp & Cpk): measures whether the process, as it runs today, can consistently meet customer specification limits.

Analyze Phase Tools

The Analyze phase moves the team from “here’s the baseline” to “here’s what’s causing the problem.” It uses both structured brainstorming and statistical testing. The discipline here is resisting the urge to jump to a favorite fix. The qualitative tools (Fishbone, 5 Whys) list the suspected causes. Then the statistical tools (Hypothesis Testing, Regression) confirm or eliminate each suspect with evidence.

  • Cause and Effect Diagram (Fishbone/Ishikawa): a structured brainstorming tool that sorts possible causes into categories, commonly the 6Ms. The categories branch off a central “spine” toward the effect.
  • 5 Whys: a simple root-cause technique of repeatedly asking “why” to peel back symptoms and reach the underlying cause of a problem.
  • Root Cause Analysis: the umbrella discipline of finding the true cause of a problem instead of treating symptoms. It usually combines several tools on this page.
  • Failure Mode Effects Analysis (FMEA): a systematic risk-assessment tool. It scores failure modes by severity, occurrence, and detection to show which risks need action first.
  • Hypothesis Testing: the statistical framework for deciding whether a difference in your data is real. The alternative is that chance alone explains it.
  • Regression Analysis: a statistical method for modeling how inputs relate to an output. It measures how much the output moves when an input changes.
  • Scatter Diagrams: a quick plot of two variables against each other. It’s often the first check for a relationship, before a formal regression.
  • Multi-Vari Study: a structured way to observe a process without changing it. It narrows down which family of variation drives the problem: within-unit, between-unit, or over-time.
  • Cause and Effect Matrix (X-Y Diagram): a scoring matrix for input variables (X’s). It ranks each one by how strongly it affects the outputs (Y’s) the customer cares about.
  • TRIZ: a problem-solving method built from patterns in thousands of patents. It helps find creative solutions that resolve a contradiction instead of compromising.

Improve Phase Tools

The Improve phase is where the team generates, tests, and selects the actual solution, then pilots it before a full rollout. This phase uses two families of tools. Creativity tools help a team generate and organize solutions (Affinity Diagram, Tree Diagram). Verification tools confirm a solution works at small scale first (DOE, a pilot run).

  • Design of Experiments (DOE): a rigorous way to test several factors at once. It shows which factors, and which combinations, drive the outcome.
  • Value Stream Mapping: maps the full flow of material and information needed to deliver a product or service. Its purpose is to separate value-added steps from waste.
  • Kaizen: a focused, rapid-improvement event aimed at removing one source of waste quickly. The word also names a broader philosophy of small, continuous improvements.
  • Poka-Yoke (Error-Proofing): designs a process so a specific mistake becomes impossible or is caught immediately. It replaces inspection after the fact.
  • 5S: a workplace organization method (Sort, Set in Order, Shine, Standardize, Sustain). It removes clutter and variation from the workspace itself.
  • SMED (Quick Changeovers): a method for radically reducing the time it takes to switch a process or machine from running one product to running another.
  • Pugh Analysis: a structured decision matrix for comparing several candidate solutions against a baseline, across multiple weighted criteria.
  • Tree Diagram: breaks a broad goal down into progressively more specific tasks and sub-tasks needed to achieve it.
  • Affinity Diagram: organizes many separate ideas into natural groups. It helps make sense of brainstorming on an unfamiliar problem.
  • Interrelationship Digraph: maps cause-and-effect links between connected issues. It shows which issues are root drivers and which are downstream effects.
  • Prioritization Matrix: ranks competing options against shared, weighted criteria. That focuses effort where it has the most impact.
  • House of Quality (QFD): translates customer requirements into design characteristics. That way, what gets built maps back to what the customer asked for.

Control Phase Tools

The Control phase locks in the gains from Improve. Otherwise the process quietly drifts back once the team moves on. This phase is the most likely to be shortchanged under deadline pressure. That’s backwards. A fix with no monitoring plan is temporary, no matter how good the solution was.

  • Control Plan: documents how the new process will be monitored. It names who owns each check, how often it runs, and what to do if a measurement goes out of range.
  • Statistical Process Control (SPC): the ongoing use of control charts on a live process. It separates normal variation from a real shift that needs action.
  • Standard Work: documents the current best way to perform a task. As a result, the improvement is followed consistently instead of left to habit.
  • Response Plan: a control-phase tool named in the IASSC BOK. It’s a predefined plan for the moment a metric goes out of control, so nobody improvises under pressure.

Lean Tools (Used Across Every Phase)

Lean tools focus on removing waste and improving flow. They show up throughout a Lean Six Sigma project, not in one DMAIC phase. The DMAIC tools above are mostly diagnostic: they find what’s wrong and prove it. Lean tools, by contrast, are prescriptive. They remove a known type of waste once you’ve found it. That’s why Lean and DMAIC tools often pair up. For example, a Spaghetti Diagram (Lean) reveals wasted motion, and a revised Process Map (DMAIC) documents the fix.

  • Classic Wastes (the 8 Wastes): the standard Lean checklist of waste types, often remembered as TIMWOODS. It trains your eye to spot non-value-added work.
  • Kanban: a visual signal that pulls work through a process based on real downstream demand. It replaces pushing work from a forecast.
  • Spaghetti Diagram: traces the physical path a person, part, or document takes through a workspace. It usually exposes an absurd amount of travel at a glance.
  • 8D Method: an 8-step, team-based problem-solving method common in automotive and manufacturing. It runs from containing a problem to preventing it from coming back.

The Tools You’ll Actually Use Most Often

Every one of these Six Sigma tools earns its place in some BOK. In practice, though, a handful carry most real projects. Say you had time to master five tools before a real project, not an exam. Practitioners consistently name the same short list:

  • Process Mapping, because almost nothing else is possible until the team agrees on how the process really works today.
  • Cause and Effect (Fishbone) Diagram, because it’s the cheapest way to get a team’s knowledge onto one page. It comes before any statistics.
  • Pareto Chart, because it answers the single most useful question on any project: out of everything that could be wrong, what’s actually worth our time?
  • Control Charts, because they follow a process from Measure through Control. They baseline the process and later prove the fix held.
  • FMEA, because it forces a team to think about failure before it happens, rather than reacting to it after a customer finds it first.

That’s no reason to skip the rest. A true root-cause question will need Hypothesis Testing or DOE. Similarly, a project with a safety or planning angle will need the qualitative Improve tools. But if the full list feels overwhelming, get comfortable with those five first.

The Classic “7 Tools” Sets

Two groupings of Six Sigma tools show up by name on nearly every certification exam. Know them as named sets, not just as single tools.

  • The 7 Basic Quality Tools: the original quality-control toolkit. It includes the Cause and Effect Diagram, Check Sheet, Control Chart, Histogram, Pareto Chart, Scatter Diagram, and Process Mapping (sometimes taught as a Flowchart). Every one of these has its own dedicated page above.
  • The 7 Management and Planning Tools: a newer, more qualitative set for planning complex, non-numerical problems. It includes the Affinity Diagram, Interrelationship Digraph, Tree Diagram, Prioritization Matrix, Matrix Diagram, PDPC, and Activity Network Diagram.

Choosing the Right Tool

With this many Six Sigma tools, the skill is not memorizing them all. It’s knowing which tool fits the question you’re asking. A few quick rules of thumb:

  • If you need to agree on what the problem is, reach for Define phase tools (Project Charter, SIPOC, VOC, CTQ).
  • If you need to know how big the problem is right now, reach for Measure phase tools (Process Mapping, Histogram, Control Charts, Process Capability).
  • If you need to know why it’s happening, reach for Analyze phase tools (Fishbone, 5 Whys, Hypothesis Testing, Regression).
  • If you need to test or implement a fix, reach for Improve phase tools (DOE, Kaizen, Poka-Yoke, Pugh Analysis).
  • If you need to make sure the fix sticks, reach for Control phase tools (Control Plan, SPC, Standard Work).

Here’s how that plays out on an actual project. Say a Green Belt is asked to fix a call center’s slow response times. The project doesn’t start with a statistical test. Instead, it starts with a Project Charter to pin down the scope: which queue, which customers, what counts as “too slow.” It also needs a SIPOC to confirm where the process actually begins and ends.

Only once that’s settled does the team build a Process Map and start pulling Control Chart data to see what “normal” currently looks like. If the data shows real, unexplained variation, a Fishbone Diagram and a few rounds of 5 Whys narrow the list of suspects, and Hypothesis Testing confirms which suspected cause is statistically real versus which one just looked convincing in a meeting. Only then does the team move to Kaizen or a small DOE to test a fix, and finally a Control Plan to make sure response times don’t quietly drift back up three months later. Notice that the team never needed all 40-plus tools. They needed about seven, in a specific order, each answering one question.

Most real projects don’t use every Six Sigma tool on this page. They use the handful that answer the question in front of the team. If you’re studying for a certification exam, your belt’s body of knowledge tells you which tools you must know in depth and which you only need to recognize. For example, a Yellow Belt should recognize most tools here. A Black Belt, by contrast, should run the statistical ones (hypothesis testing, regression, DOE) without guidance.

Frequently Asked Questions

How many Six Sigma tools are there?

There’s no single official count. Different bodies of knowledge (ASQ, IASSC, Villanova) name somewhat different lists. Also, some tools overlap with general project management or Lean. This page covers about 40 of the most commonly taught Six Sigma tools, grouped by DMAIC phase. That covers most of what any certification body will test.

Which Six Sigma tools does a Black Belt need to know that a Green Belt doesn’t?

The split is depth, not which tools a Black Belt knows. Both belts learn most of the Six Sigma tools on this page. However, a Black Belt runs the advanced statistical tools independently: multi-factor DOE, advanced regression and ANOVA, and less common hypothesis tests. A Green Belt runs and interprets the basics, with support.

Are Lean tools and Six Sigma tools the same thing?

No, though they’re used together so often that the line blurs in practice. Six Sigma tools mostly reduce variation and defects through data. Lean tools, on the other hand, reduce waste and improve flow, often without statistics. A combined Lean Six Sigma project draws from both. Which one leads depends on whether the problem is variation or flow and waste.

When you’re ready, there are a few ways I can help:

First, join 12,000+ other Six Sigma professionals by subscribing to my email newsletter. A short read every Monday to start your work week off correctly. Always free.

* * *

If you’re looking to pass your Six Sigma Green Belt or Black Belt exams, I’d recommend starting with my affordable study guide:

1)→ 🟢Pass Your Six Sigma Green Belt: a study guide organized by the exam Body of Knowledge, 1,000+ practice questions with detailed answer explanations, and 15+ full-length mock exams

2)→ ⚫Pass Your Six Sigma Black Belt: the full Black Belt Body of Knowledge, 2,000+ practice questions with detailed answer explanations, and 15+ full-length mock exams

You’ve spent so much effort learning Lean Six Sigma. Why leave passing your certification exam up to chance? This comprehensive study guide offers 1,000+ exam-like questions for Green Belts (2,000+ for Black Belts) with full answer walkthroughs, access to instructors, detailed study material, and more.

​ Thousands have used this system to prepare. Join them here. 
TSF #40: Drowning in Six Sigma Content? Here’s How to Get Unstuck

If you’ve ever opened your Six Sigma material and thought, “There’s no way I can get through all of this,” you’re not alone.

Most serious candidates don’t fail because they’re lazy. They fail because the signal is buried under too much noise. Every book, every practice exam, every video is asking for your attention at once.

The good news: you don’t need to master everything at the same time. You need to narrow the signal down to one topic and attack it at a time.

In this post, I’ll walk you through a simple way to:

  • Pick one topic that actually moves your score
  • Build short, repeatable drills around it
  • Use spaced repetition so it sticks
  • Measure progress so you know it’s working

If you’re feeling overwhelmed, this is how you get back to steady, confident progress.

Step 1: Identify the one topic worth your time (not ten)

When everything feels important, nothing gets done.

Instead of asking “How do I cover the entire BOK?”, ask a smaller question:

“What’s the one topic that, if I improved it this week, would move my score the most?”

A few ways to find that topic:

  • Look at your last practice exam: Which question types did you miss repeatedly? Was there a cluster around a single idea (for example, control charts, hypothesis tests, or basic probability)?
  • Think about the questions you avoid: Which topics make you silently hope they don’t show up on the exam?
  • Look at where you get bogged down in the book: Which chapter do you keep skipping or “saving for later”?

Pick one topic that consistently trips you up. That’s your focus for the week.

If you’re not sure, here are common high‑leverage areas:

  • Basic probability and distributions
  • Hypothesis testing “which test when”
  • Measurement systems analysis (MSA)
  • Process capability vs process performance
  • Control charts basics

Don’t overthink it. Pick one and commit to it for seven days.

Step 2: Design short, repeatable drills

Once you’ve chosen a topic, the goal is not to read everything ever written about it. The goal is to interact with it in short, focused bursts.

Design a simple drill you can repeat in 10 to 15 minutes:

  • For concepts: Take 5 to 10 practice questions on that exact topic. After each one, write down in one sentence why the right answer is correct.
  • For formulas: Write the formula from memory, then explain each term in plain English. Plug in simple numbers and check that the result makes intuitive sense.
  • For process tools: Sketch a SIPOC, process map, or control chart from a simple scenario. Label the key parts and ask yourself what would change if the inputs changed.

A good drill is:

  • Small enough that you don’t dread starting it
  • Concrete enough that you can tell whether you did it correctly
  • Repeatable enough that you can run it several times this week

If a drill feels like a two‑hour project, it’s too big. Cut it down until it fits into a 10 to 15 minute window.

Step 3: Use spaced repetition so it sticks

One long session rarely creates real understanding. Spaced repetition does.

Once you have your drill, schedule a few short revisit points:

  • Day 1: Run the drill once.
  • Day 3: Run it again, ideally with slightly different examples or questions.
  • Day 7: Run it a third time, focusing on anything that still feels shaky.

You don’t need a fancy app. A calendar reminder or a simple checklist works.

The key is:

  • Don’t wait until you’ve “forgotten everything.”
  • Don’t cram all your practice into one night and call it done.
  • Use short, repeated touches to move the topic from “I sort of recognize this” to “I can explain and apply this under exam pressure.”

When you hit the Day 7 run and it feels almost boring, that’s a good sign. You’ve narrowed the signal and strengthened it.

Step 4: Leverage micro‑explanations

A reliable way to check whether you understand something is to explain it in plain language.

For your chosen topic, try:

  • Writing a one‑paragraph explanation as if you were helping a colleague at work.
  • Answering, in one or two sentences: “What is this?” and “When would I use it?”
  • Taking one practice question you got wrong and writing a short “post‑mortem”: What was the question really asking? Which clue in the wording should have pointed you to the right tool?

You don’t need to turn these into essays. The goal is to force your brain to organize the idea clearly, not to impress anyone with your writing.

If you struggle to write a clean, short explanation, that’s a sign you’ve found a useful gap to close, before the exam does it for you.

Step 5: Measure progress with simple metrics

Narrowing the signal is only useful if it translates into progress.

For the one topic you picked this week, track:

  • Drill completion: how many 10 to 15 minute sessions did you actually run?
  • Accuracy: did your question‑level accuracy on that topic improve from, say, 40% to 70%?
  • Confidence: on a 1 to 5 scale, how confident did you feel about that topic on Day 1 vs Day 7?

You’re not trying to be perfect. You’re looking for evidence that focused work on one topic moves the needle.

When you see that movement, two things happen:

  • Your score improves.
  • The feeling of “too much to learn” gets replaced by “I know how to tackle this, one topic at a time.”

Step 6: Make it social (lightly)

If you have even one friend or colleague also studying, use that to your advantage:

  • Take turns explaining the same topic to each other in a few minutes.
  • Swap 3 to 5 questions you each found tricky and walk through why.
  • Set a shared goal for the week (for example, “By Sunday we’ve each run three drills on control charts”).

If you don’t have a study buddy, you can still simulate this:

  • Explain the topic out loud as if you were teaching it.
  • Record a quick voice note summarizing what you learned after each drill.
  • Pretend you’re writing a short note to a future version of yourself who’s about to take the exam.

Social accountability makes it much easier to keep going when you’re tired.

Here’s what I’d like you to do this week:

Pick one Six Sigma topic that feels heavy or confusing and run three short drills on it.

Once you’ve done that, leave a comment and tell me:

  • Which topic you picked, and
  • One thing that felt clearer after your drills.

I read these, and your answers help me decide what to cover next.

If you want a full sequence of topics instead of picking one at a time, see the Six Sigma Road Maps.

Best, Ted

When you’re ready, there are a few ways I can help:

First, join 12,000+ other Six Sigma professionals by subscribing to my email newsletter. A short read every Monday to start your work week off correctly. Always free.

* * *

If you’re looking to pass your Six Sigma Green Belt or Black Belt exams, I’d recommend starting with my affordable study guide:

1)→ 🟢Pass Your Six Sigma Green Belt: a study guide organized by the exam Body of Knowledge, 1,000+ practice questions with detailed answer explanations, and 15+ full-length mock exams

2)→ ⚫Pass Your Six Sigma Black Belt: the full Black Belt Body of Knowledge, 2,000+ practice questions with detailed answer explanations, and 15+ full-length mock exams

You’ve spent so much effort learning Lean Six Sigma. Why leave passing your certification exam up to chance? This comprehensive study guide offers 1,000+ exam-like questions for Green Belts (2,000+ for Black Belts) with full answer walkthroughs, access to instructors, detailed study material, and more.

​ Thousands have used this system to prepare. Join them here.