Variation is the enemy! It can introduce waste and errors into a process. The more variation, the more errors. The more errors, the more waste.
What is Variation?
Quick answer: it’s a lack of consistency. Imagine that you’re manufacturing an item. Say, a certain-sized screw. Firstly, you want the parameters to be the same in every single screw you produce. Material strength, length, diameter, and thread frequency must be uniform. Secondly, your customers want a level of consistency. They want a certain size of screw all to be the same. Using a screw that’s the wrong size might have serious consequences in a construction environment. So a lack of consistency in our products is bad.
We call the differences between multiple instances of a single product variation.
(Note: in some of Game Change Lean Six Sigma’s videos, they misstate Six Sigma quality levels as 99.999997 where it should be six sigma = 99.99966 % )
Why Measure Variation?
We measure it for a couple of reasons:
- Reliability: We want our customers to know they’ll always get a certain level of quality from us. Also, we’ll often have a Service Level Agreement or similar in place. Consequently, every product needs to fit specific parameters.
- Costs: Variation costs money. So, to lower costs, we need to keep levels low.
Measuring Variation vs. Averages
Once, companies tended to measure process performance by average. For example, average tensile strength or average support call length. However, a lot of companies are now moving away from this. Instead, they’re measuring variation. For example, differences in tensile strength or support call lengths.
Average measurements give us some useful data. But they don’t give us information about our product’s consistency. In most industries, focusing on decreasing fluctuations in processes increases performance. It does this by limiting factors that cause outlier results. And it often improves averages by default.
How Do Discrepancies Creep into Processes?
Discrepancies occur when:
- There is wear and tear in a machine.
- Someone changes a process.
- A measurement mistake is made.
- The material quality or makeup varies.
- The environment changes.
- A person’s work quality is unpredictable.
There are six elements in any process:
- Method
- Mother Nature, or Environmental
- Man or People
- Measurement
- Machine
- Materials
In Six Sigma, these elements are often displayed like this:
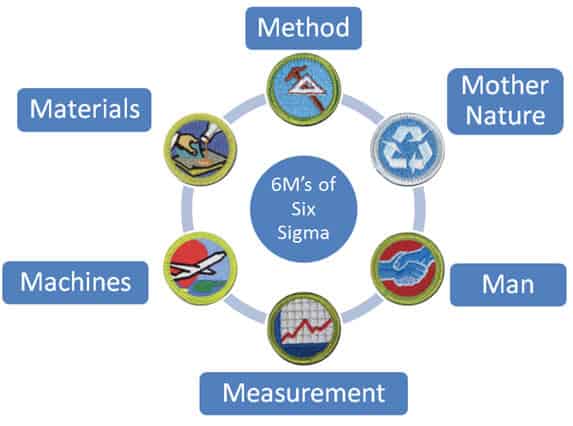
Discrepancies can creep into any or all elements of a process.
To read more about these six elements, see 5 Ms and one P (or 6Ms).
For an example of changing processes contrarily causing variation, see the Quincunx Demonstration.
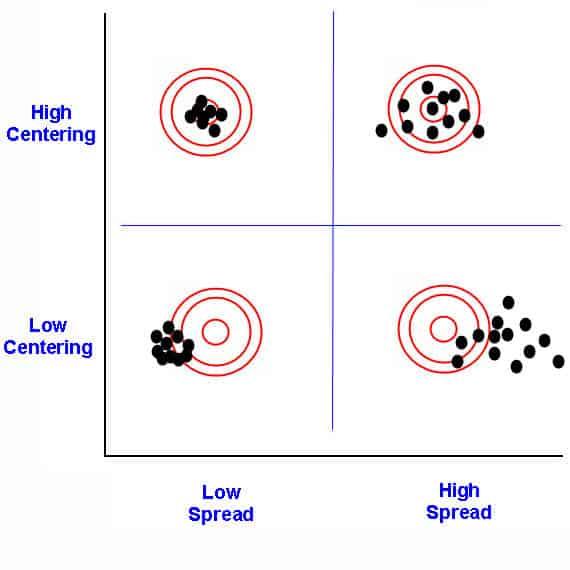
The process spread vs. centering
Types of Variation
There are two basic types that can occur in a process:
- common cause
- special cause
Common Cause
Common cause variation happens in standard operating conditions. Think about the factory we mentioned before. Fluctuations might occur due to the following:
- temperature
- humidity
- metal quality
- machine wear and tear.
Common cause variation has a trend that you can chart. In the factory mentioned before, product differences might be caused by air humidity. You can chart those differences over time. Then, you can compare that chart to Weather Bureau’s humidity data.
Special Cause
Conversely, special cause variation occurs in nonstandard operating conditions. Let’s go back to the example factory mentioned before. Disparities could occur if:
- A substandard metal was delivered.
- One of the machines broke down.
- A worker forgot the process and made a lot of unusual mistakes.
This type of variation does not have a trend that can be charted. Imagine a supplier delivers a substandard material once in a three-month period. Subsequently, you won’t see a trend in a chart. Instead, you’ll see a departure from a trend.
Why is it Important to Differentiate?
It’s important to separate a common cause and a special cause because:
- Different factors affect them.
- We should use different methods to counter each.
Treating common causes as special causes leads to inefficient changes. So, too, does treating a special cause like a common cause. The wrong changes can cause even more discrepancies.
How to Identify
Run Charts
Use run charts to look for common cause variation.
- Mark your median measurement.
- Chart the measurements from your process over time.
- Identify runs. These are consecutive data points that don’t cross the median marked earlier. They show common cause variation.
Control Charts
Meanwhile, use control charts to look for special cause variation.
- Mark your average measurement.
- Mark your control limits. These are three standard deviations above and below the average.
- Identify data points that fall outside the limits marked earlier. In other words, it is above the upper control limit or below the lower control limit. These show special cause variation.
Calculating
Variation is the square of a sample’s standard deviation.
Variation = SD2
How to Find the Cause of Variation
So far, you’ve found no significant variation in your process. However, you haven’t found what its cause might be. Hence, you need to find the source.
You can use a formal methodology like Six Sigma DMAIC or a multi-vari chart to identify the source of variation.
How to Find and Reduce Hidden Causes of Variation
DMAIC methodology is the Six Sigma standard for identifying a process’s variation, analyzing the root cause, prioritizing the most advantageous way to remove a given variation, and testing the fix. The tools you would use depend on the kind of variation and the situation. Typically, we see either a “data door” or a “process door” and the most appropriate use techniques.
You could try Lean tools like Kaizen or GE’s WorkOut for a smaller, shorter cycle methodology.
How to Counter Variation
Once you identify its source, you need to counter it. As we implied earlier, the method you use depends on its type.
Counter common cause variation using long-term process changes.
Counter special cause variation using exigency plans.
Let’s look at two examples from earlier in the article.
- Product differences due to changes in air humidity. This is a common cause of variation.
- Product differences due to a shipment of faulty metal. This is a special cause variation.
Countering common cause variation
As stated earlier, to counter common cause variation, we use long-term process changes. Air humidity is a common cause. Therefore, a process change is appropriate.
We might subsequently introduce a check for air humidity. We would also introduce the following step. If the check finds certain humidity levels, change the machine’s temperature to compensate. The new check would be run several times a day. Whenever needed, staff would change the temperature of the machine. These changes then lengthen the manufacturing process slightly. However, they also decrease product differences in the long term.
Countering special cause variation
As mentioned earlier, we need exigency plans to counter special cause variation. These are extra or replacement processes. We only use them if a special cause is present, though. A large change in metal quality is unusual. So we don’t want to change any of our manufacturing processes.
Instead, we implement a random quality check after every shipment. Then, an extra process to follow if a shipment fails its quality check. The new process involves requesting a new shipment. These changes don’t lengthen the manufacturing process. They do add occasional extra work. But extra work happens only if the cause is present. Then, the extra process eliminates the cause.
Combining Variation
Rather than finding variation in a single sample, you might need to figure out a combined variance in a data set. For example, a set of two different products. For this, you’ll need the variance sum law.
Firstly, look at whether the products have any common production processes.
Secondly, calculate the combined variance using one of the formulas below.
No shared processes
What if the two products don’t share any production processes? Great! Then, you can use the simplest version of the variance sum law.
Variance(X + Y) = Variance(X) + Variance(Y)
Variance(X - Y) = Variance(X) + Variance(Y)
Shared processes
What if the two processes do share some or all production processes? That’s OK. You’ll need the dependent form of the variance sum law instead.
Variance(X + Y) = Variance(X) + Variance(Y) + Covariance(X,Y)
Variance(X - Y) = Variance(X) + Variance(Y) - Covariance(X,Y)
Calculate covariance using the following formula.
Cov(X,Y) = Σ ((X-μ) * (Y-ν)) / n-1
Where:
- μ is the mean value of X.
- ν is the mean value of Y.
- n = the number of items in the data set.
https://www.youtube.com/watch?v=0nZT9fqr2MU
Additional Resources
What You Need to Know for Your Six Sigma Exam
Combating variation is integral to Six Sigma. Therefore, all major certifying organizations require that you have substantial knowledge of it. So, let’s walk through how each represents what they expect.
Green Belts
ASQ Six Sigma Green Belt
ASQ requires Green Belts to understand the topic as it relates to:
Exploratory data analysis
Create multi vari studies. Then, interpret the difference between positional, cyclical, and temporal variation. Apply sampling plans to investigate the largest sources. (Create)
IASSC Six Sigma Green Belt
IASSC requires Green Belts to understand patterns of variation. Find this in the Analyze Phase section.
Black Belts
Villanova Six Sigma Black Belt
Villanova requires Black Belts to understand the topic as it relates to:
Six Sigma’s basic premise
Describe how Six Sigma has fundamentally two focuses–variation reduction and waste reduction that ultimately lead to fewer defects and increased efficiency.
Understand the concept of variation and how the six Ms have an influence on the process.
Understand the difference between assignable cause and common cause variation along with how to deal with each type.
Multi vari studies
Create and interpret multi vari studies to interpret the difference between within piece, piece to piece, and time to time variation.
Calculate, analyze, and interpret measurement system capability using repeatability and reproducibility, measurement correlation, bias, linearity, percent agreement, precision/tolerance (P/T), precision/total variation (P/TV), and use both ANOVA and control chart methods for non-destructive, destructive, and attribute systems.
ASQ Six Sigma Black Belt
ASQ requires Black Belts to understand the topic as it relates to:
Multivariate tools
Use and interpret multivariate tools such as principal components, factor analysis, discriminant analysis, multiple analysis of variance, etc to investigate sources of variation.
Use and interpret charts of these studies and determine the difference between positional, cyclical, and temporal variation.
Attributes data analysis
Analyze attributes data using logit, probit, logistic regression, etc to investigate sources of variation.
Statistical process control (SPC)
Define and describe the objectives of SPC, including monitoring and controlling process performance, tracking trends, runs, etc, and reducing variation in a process.
IASSC Six Sigma Black Belt
IASSC requires Black Belts to understand patterns of variation in the Analyze Phase section. It includes the following:
- Multi vari analysis.
- Classes of distributions.
- Inferential statistics.
- Understanding inference.
- Sampling techniques and uses.
Candidates also need to understand its impact on statistical process control.
ASQ Six Sigma Black Belt Exam Questions
Question: A bottled product must contain at least the volume printed on the label. This is chiefly a legal requirement. Conversely, a bottling company wants to reduce the amount of overfilled bottles. But it needs to keep volume above that on the label.
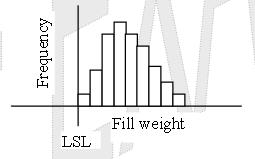
Look at the data above. What is the most effective strategy to accomplish this task?
(A) Decrease the target fill volume only.
(B) Decrease the target fill variation only.
(C) Firstly, decrease the target fill volume. Then decrease the target fill variation.
(D) Firstly, decrease the target fill variation. Then decrease the target fill volume.
Answer:
D: Reduce variation in your process first, then try to make improvements. Otherwise, your results from a change can be worse. For example, think of the quincunx demonstration. It shows that just changing your puck placement doesn’t help. In fact, it makes your results worse. This is because you didn’t shrink the dispersion. In other words, you didn’t reduce variation, so your results varied even more.
When you’re ready, there are a few ways I can help:
First, join 30,000+ other Six Sigma professionals by subscribing to my email newsletter. A short read every Monday to start your work week off correctly. Always free.
—
If you’re looking to pass your Six Sigma Green Belt or Black Belt exams, I’d recommend starting with my affordable study guide:
1)→ 🟢Pass Your Six Sigma Green Belt
2)→ ⚫Pass Your Six Sigma Black Belt
You’ve spent so much effort learning Lean Six Sigma. Why leave passing your certification exam up to chance? This comprehensive study guide offers 1,000+ exam-like questions for Green Belts (2,000+ for Black Belts) with full answer walkthroughs, access to instructors, detailed study material, and more.
Comments (6)
Ijust wanted to thank you Ive been calling and searching reading etc never could find one source to stay focused on to study. Thanks to you now I have found that course and plan to stay on track any recommendations Thanks for helping and taking the time to help people I really appreciate this really thanks any suggestioins you have for me I appreciate.
May God bless you and thanks
Again, you’re welcome, Anthony. I have a write up on how to approach any Six Sigma exam here.
Hello,
If during Analyze phase of DMAIC the team undersands that the process has many common causes of variation and the process should be redesigned, can the team switch to DMADV?
Absolutely. Pivoting is essential in many cases as new information is discovered.
I would caution that clear communication with your stakeholders is essential here. You want to ensure that the cost to redesign & deploy the new process doesn’t exceed the benefit you’d achieve.
Hi, the link above under 6-M-pictures does lead to nowhere: “5 Ms and one P (or 6Ms)”.
Thank you, Tatjana! Updated!