A stem and leaf plot, also known as a stem plot, is a technique to categorize either continuous or discrete values. It is used to organize data as they are collected.
Stem and leaf offer a quick and novel way for simultaneously sorting and displaying data sets where each number in the data set is divided into two parts: a stem (all numbers except the last digit) and a leaf (only the last digit). For example, in the numbers 38 and 52, the stems are 3 and 5, while the leaves are 8 and 2.
Significance of Stem and Leaf Plot
A stem and leaf plot was developed by John Tukey an American mathematician in 1977. Stem and leaf plots are some of the best ways to not only study but track information as well. Stem and leaf plots have been around for decades and are like a cross between a histogram and a check sheet. The difference with this type of graph is that it preserves the actual data as well as being the most like a frequency distribution.
Stem and leaf plots are methods for showing the frequency with which certain classes of values occur. It will organize data visually and will be able to interpret data and draw conclusions using the plot.
Uses
- Effective way to organize the data. A stem and leaf plot looks something like a bar graph.
- Shows data in an organized way, so it can be analyzed easily.
- Organizes data so it is easy to compute the median, mode, and quartiles.
- Easy to compare different sets of data together at the same time.
How to Create a Stem-and-leaf plot
There are many different ways to create a stem and leaf plot but they all serve the same purpose at the end of the day.
- Sort the numerical data in ascending order.
- Analyze the data to determine the stem and the leaf.
- Draw a line and lists the possible stems in a single column from lowest to highest on the left side of the line.
- Then for each stem, record all the leaves associated with that stem. Also, note that leaves are in numerical order.
- The stem and leaf plot always has a Key, which normally describes what the entry means (stem and a leaf). It helps to read the diagram.
- Finally, you can compute the median, mode, and Quartiles.
Example
Example: A teacher asked 23 of her male students how many books they had read in the last 4 years. Draw a stem and left diagram for the following data.
32,55,12,18,23,26,24,28,44,53,27,16,14,34,29,31,41,17,11,32,54,48,45
First, Sort the numerical values in ascending order
11,12,14,16,17,18,23,24,26,27,28,29,31,32,32,34,41,44,45,48,53,54,55
Analyze the data and determine stem and a leaf: The minimum value is 11 and the maximum value is 55.
Draw a line and lists the possible stems in a single column from lowest to highest on the left side of the line.
Then for each stem, record all the leaves associated with that stem. Also, note that leaves are in numerical order.
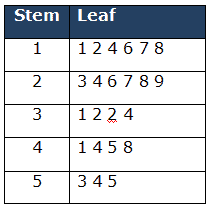
Key: 2|7 means 27 books
Total count values =23
- Median: The median is the middle value = n+1/2 = 23 +1/2 =12th value =29 books.
- Mode: The number which appears most often in a set of numbers= 32 number repeated twice. Hence Mode is 32 books.
- Q1 (Lower Quartile) = Find ¼ (n+1) =24/4=6th value is 18 books.
- Q3 (Upper Quartile) = Find ¾(n+1)= 3*24/4= 18th value is 44 books.
- The Quartile range = 44-18 = 26 books.
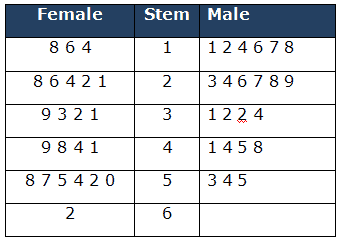
Back to Back stem-and-leaf-plot
Back to back stem and leaf diagrams can be used to compare different sets of data relating to the same subject. In other words, it helps to compare different sets of data together at the same time.
Example: For the above example, add 23 female students’ books reading data.

Sort the data in ascending order for both male and female. Then identify the stem and respective leaves for male and female.
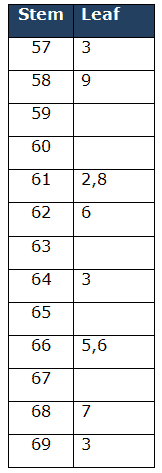
Stem-and-leaf-plot with Decimals
There are some stem and leaf plots out there that have decimals along with it. When you are tracking your leaves, all you have to do is include the decimal points as well.
It is not that different from a normal stem and leaf plot, only in which you have to designate your stems and leaves to where you want them to begin. For instance, your stems may be the ones place while your leaves are the decimal points. It is all in how you do the graph and what numerical information you are trying to convey. Stem and leaf plots are very flexible this way.
Example: The average heights of ten high school students in inches are reported below. Draw a stem and left diagram for the following students’ heights data.
61.2, 69.3, 58.9, 57.3, 61.8, 62.6, 66.5, 68.7, 66.6, 64.3
Stem and Leaf Plot Activities
There are many different activities in which you can involve a stem and leaf plot. For example, If there is a football game going on, you can track the number of yards someone has run; to make stem and leaf plots even more fun, you can even track the score in a video game and see who has the highest data on the plot.
There is no shortage of activities, usefulness, and fun a stem and leaf plot can achieve. It is up to you to find out the different ways to utilize them and make your own graph.
Videos
Notes on Stem and Leaf Plots
- Box Plots, Histograms, and Stem and Leaf plots all display the same data.
- There is no real advantage of using a histogram over a stem and leaf.
Comments (3)
stem and leaf…I can do!
Graphics OK but it reads like it was written by a very careless unprofessional semi-literate. No QA/proofreading on a site that wants to teach us math stuff? Not for me.
Thanks for the feedback, Bill.
If you have specific notes that I can fix, I’m happy to attend to them.
If you want to be yet another nameless troll shitting on work that people do and put into the public for free, then great for you.
Best, Ted.