Today I’ll introduce Alex Johnston. He is a Six Sigma Black Belt whom I’ve worked with building question sets for the Green Belt Study Guide. He’s going to walk through a real-world example using the Pareto Priority Index.
One of the most common requests coming out of the survey is for real-life six sigma case studies. Whether you are new to Six Sigma or you have been involved for a while, it’s always interesting to see how fellow practitioners apply their skills to real-world problem.
Now for Alex.
The Data Driven Approach to Project Prioritization
I have spent a lot of my time advising small businesses on process improvement. Most of these companies make consumer goods with a small team. They typically have a deep knowledge and passion for their product, but very limited engineering experience. I am often met with (at worst) outright resistance or (at best) perplexed stares when I suggest the implementation of Lean or Six Sigma.
There is an unfounded belief in many smaller organizations that Six Sigma is really only for giant companies with engineering staffs and continuous improvement teams. I am going to discuss how one of the smaller companies I worked with gained valuable insight using Six Sigma tools.
There is an unfounded belief in many smaller organizations that Six Sigma is really only for giant companies with engineering staffs and continuous improvement teams.
-Alex Johnston
Six Sigma for Small(er) Business Example
The customer is a smaller artisan candy producer in the Pacific Northwest. They were nearly a completely manual operation. The company knew that they would need to invest in process and packaging automation equipment to increase their output and fight off rising labor costs.
In a traditional academic setting, you would look at this problem and say that it’s a classic “Theory of Constraints”-type situation. And the company should simply automate the slowest part of the process first. Process speed is only one variable in the equation for this company.
The company was getting a loan for the project. That meant the budget was capped and the interest rate was considerable. They would also have to contend with long lead times for many of the automation options because almost everything is built to order. The problem at hand was ‘How should we decide where to focus their automation dollars?’
Introducing the Pareto Priority Index
There is something in the Six Sigma tool box for just this sort of situation. It is called the Pareto Priority Index (yes, the same Pareto who invented the 80/20 rule).
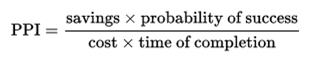
The Pareto Priority Index or PPI takes in a project’s savings, its likelihood of being successful, cost of the project, as well as its implementation time. All of these inputs are factored together like in the below formula to give you a single, objective metric for comparing projects.
Pareto Priority Index
Pareto Priority Index Equation
Pareto Priority Index: Start with a Chart
| Project | Cost | Completion Time | Probability of Success | Savings | PPI Value |
| Flow Wrapper | $75,000 | 18 weeks | 90% | Est. $600,000 | 0.400 |
| Cooling Tunnel | $35,000 | 16 weeks | 90% | Est. $90,000 | 0.144 |
| Candy Drop Roller | $11,000 | 22 weeks | 95% | Est. $30,000 | 0.118 |
| Chocolate Depositor | $105,000 | 18 weeks | 90% | Est. $700,000 | 0.333 |
Column Terms
Savings
Savings were estimated based on the labor and material savings the project would create during a five-year time window. The service life of the equipment is expected to be longer, but if they achieved their sales growth targets, it would most likely be obsolete by then.
Probability of Success
This was estimated based on the complexity of the equipment involved in the project. Highly customized equipment means a much higher risk of late delivery, cost overruns, or other unforeseen issues.
Cost
All costs associated with the equipment, engineering and testing, installation and support work.
Time for Completion
Lead time for equipment delivery, training, and startup time.
Case Study Results
We used this tool and combined the results with feedback from discussions with operators. This helped us come up with an effective, data driven strategy for selecting the next automation project. They selected, ordered and installed a flow wrapper and are now seeing tremendous benefit.
This same methodology can just as easily be applied to quality improvement projects. Hopefully the Pareto Priority Index can become another great asset in your Lean Six Sigma toolbox.
About the Author
Alex Johnston is an advocate for applying process improvement methodologies in new ways, especially for small businesses. He is a Georgia Tech educated Industrial & Systems Engineer and Six Sigma Black Belt. Alex is currently practicing industrial engineering in Atlanta, Georgia, USA.
Note from Six Sigma Study Guide
Please leave a comment below the article here if you enjoyed this post or have a question, . Also, please contact me here if you’d like to submit your own case study for publication. Questions on my call for Six Sigma Case Studies? See article here.
Comments (3)
Hi I am a Green Belt Six Sigma (DMAIC) Engineer in East London South Africa.I would like to find out where can I purchase study Material for training up and coming engineers.I would like have relations with American Six Sigmas so that I can be at the world class standard.
Hi Camagu – I have study materials for the Green Belt Six Sigma certification exam available here.
What other kind of materials are you looking for? I have hundreds of free articles available on this site – just use the search bar. Let me know how I can help!
Interesting example and clearly explained.
Could be improved if you actually stated more clearly that a high (and not a low) PPI is what you are looking for.
Furthermore – explanation on what PPI of 1 or 0, or greater than 1 would also be helpful.