
You may know all the statistics in the world, but if you jump straight from those statistics to the wrong conclusion, you could make a million-dollar error. That’s where hypothesis testing comes in. It combines tried-and-tested analysis tools, real-world data, and a framework that allows us to test our assumptions and beliefs. This way, we can say how likely something is to be true or not within a given standard of accuracy.
When using hypothesis testing, we create the following:
- A null hypothesis (H0): the assumption that the experimental results are due to chance alone; nothing (from 6M) influenced our results.
- An alternative hypothesis (Ha): we expect to find a particular outcome.

These hypotheses should always be mutually exclusive: if one is true, the other is false.
Once we have our null and alternative hypotheses, we evaluate them with a sample of an entire population, check our results, and conclude based on those results.
Note: We never accept a NULL hypothesis; we simply fail to reject it. We are always testing the NULL.
Basic Testing Process
The basic testing process consists of five steps:
- Identify the question
- Determine the significance
- Choose the test
- Interpret the results
- Make a decision.
Read more about the hypothesis testing process.
Terminology
This field uses a lot of specialist terminologies. We’ve collated a list of the most common terms and their meanings for easy lookup. See the hypothesis testing terminology list.
Tailed Hypothesis Tests
These tests are commonly referred to according to their ‘tails’ or the critical regions that exist within them. There are three basic types: right-tailed, left-tailed, and two-tailed. Read more about tailed hypothesis tests.
Errors in Hypothesis Testing
When discussing an error in this context, the word has a very specific meaning: it refers to incorrectly either rejecting or accepting a hypothesis. Read more about errors in hypothesis testing.
P-Values
We use P-values to determine how statistically significant our test results are and how probable we’ll make an error. Read more about p-values.
Types of Hypothesis Tests
One aspect of testing that can confuse the new student is finding which–out of many available tests–is correct to use.
Parametric Tests
You can use these tests when it’s implied that a distribution is assumed for the population or the data is a sample from a distribution (often a normal distribution).
Non Parametric Tests
You use non-parametric tests when you don’t know, can’t assume, and can’t identify what kind of distribution you have.
Hypothesis Test Study Guide
We run through the types of tests and briefly explain what each one is commonly used for. Read more about types of hypothesis tests.
Significance of Central Limit Theorem
The Central Limit Theorem is important for inferential statistics because it allows us to safely assume that the sampling distribution of the mean will be normal in most cases. This means that we can take advantage of statistical techniques that assume a normal distribution.
The Central Limit Theorem is one of the most profound and useful statistical and probability results. The large samples (more than 30) from any sort of distribution of the sample means will follow a normal distribution. The central limit theorem is vital in statistics for two main reasons—the normality assumption and the precision of the estimates.
The spread of the sample means is less (narrower) than the spread of the population you’re sampling from. So, it does not matter how the original population is skewed.
- The means of the sampling distribution of the mean is equal to the population mean µx̅ =µX
- The standard deviation of the sample means equals the standard deviation of the population divided by the square root of the sample size: σ(x̅) = σ(x) / √(n)
Central Limit Theorem allows using confidence intervals, hypothesis testing, DOE, regression analysis, and other analytical techniques. Many statistics have approximately normal distributions for large sample sizes, even when we are sampling from a non-normal distribution.
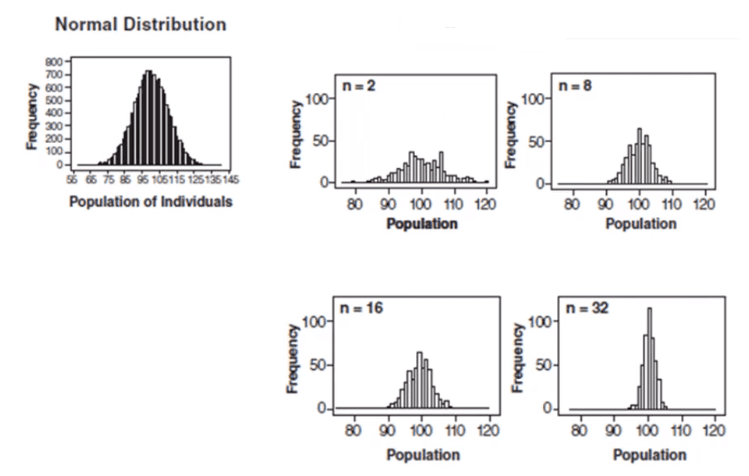
Control charts and the central limit theorem
In the above graph, subgroup sizes of 2, 8, 16, and 32 were used in this analysis. We can see the impact of the subgrouping. In Figure 2 (n=8), the histogram is not as wide and looks more “normally” distributed than Figure 1. Figure 3 shows the histogram for subgroup averages when n = 16, it is even more narrow and it looks more normally distributed. Figures 1 through 4 show, that as n increases, the distribution becomes narrower and more bell-shaped -just as the central limit theorem says. This means that we can often use well-developed statistical inference procedures and probability calculations that are based on a normal distribution, even if we are sampling from a population that is not normal, provided we have a large sample size.