Multiple linear regression is an extension of the methodology of simple linear regression. Likewise, Simple Linear Regression is used to study the two variables in which one variable is the independent variable (X) and the other one is the dependent variable (Y). In other words, predict the change in the dependent variable according to the change in the independent variable
When to Use Multiple Linear Regression
We use Multiple linear regression to study more than two variables. In fact, the basic difference between simple and multiple regression is in terms of explanatory variables. In multiple regression, unlike simple linear regression, there is more than one independent variable (X), and these independent variables are used to predict a single dependent variable (Y). Another key point is that they predict the change in the dependent variable (Y) according to the change in independent variables.
Example: The house price (Dependent variable Y) depends on the various Independent variables (X) like locality, number of bedrooms, number of bathrooms, age of the house, and also the square foot of the house.
Notes about Multiple Linear Regression
Y is the linear transformation of the X variables and is subject to the condition that the sum of squared deviations of the observed and predicted Y is minimized. In other words, it minimizes the sum of squared errors.
Residual also called error is the difference between the actual observed values of dependent variable Y and the predicted values that we get as a linear transformation of the X variables.
The coefficient of determination is R2. In summary, it is the proportion of the explained variation divided by the total variation. When we add the number of predictors to the model, then R2 will also increase despite the fact that predictors have no relation with the output variable.
Likewise, r2 (the linear coefficient of determination) and R2 (the multiple coefficient of determination) take values in the interval:
0≤ R2 ≤1
If the value of R2 is 0 then the outcome cannot be predicted, whereas if R2 is 1 outcome can be predicated and it is error-free from the independent variables (X), but same it does not mean a great model
The computation in the case of multiple regression is complex due to the number of explanatory variables in the model. However, because of the interrelationship among the variables the interpretation also changes accordingly
Assumptions of Multiple Linear Regression
Firstly, we assume Independent Residuals
Secondly, no Multicollinearity – Not too high correlation between the independent variables
Thirdly, residuals must be normally distributed
Furthermore, the relationship between each predictor variable and the outcome variable is linear
Formula to calculate Multiple Linear Regression
A first-order linear model
The formula for
two independent variables the prediction of Y is
Y= β0+β1X1+β2X2
+…….. βkXk + ε
Where
Firstly, Y is the dependent variable
Secondly, X is the independent variable
Thirdly, β0 is Y-intercept
ε is residual also called error
Finally, the βk slope coefficient for each independent variable
β can also be computed in such a way that minimizes the sum of squared errors
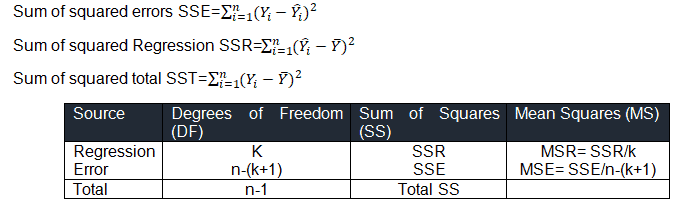
ANOVA Table for Multiple Regression
Where k is the
number of predictor variables
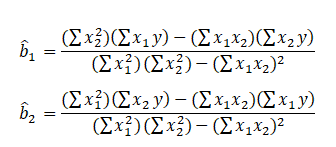
And, similarly, the estimated regression line shall be y = b̂0+b̂1X1+b̂2X2
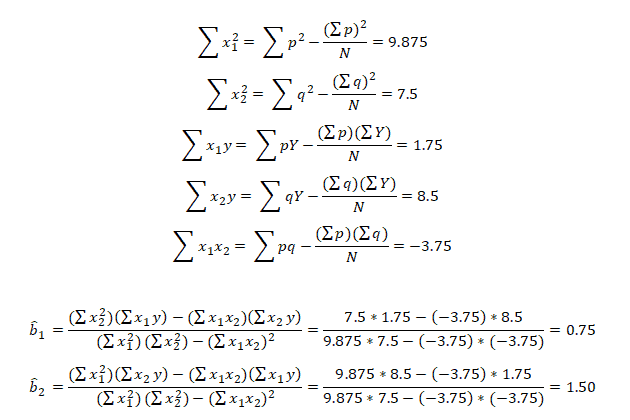
In addition, the formulas to calculate estimates of parameters betas’
b̂0 =
Y̅-b̂1X̅1– b̂2X̅2
A Second –Order Linear Model (Two Predictor Variables)
Y= β0+β1X1+β2X2+ β3 X1X2+ β4 X12++ β5 X22+ε
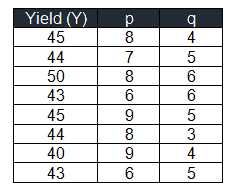
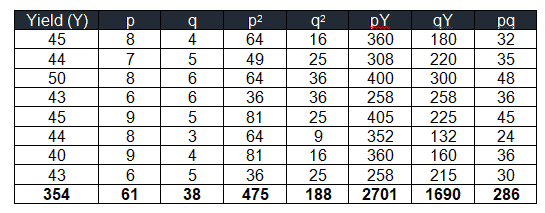
Example of Multiple Linear Regression in DMAIC
You will use Multiple Linear Regression in the Analyze phase of DMAIC to study more than two variables. In a laboratory, a chemist recorded the yield of the process impacted by the two factors. The chemist wants to consequently model the first-order regression.
Comments (4)
Excellent presentation
Glad it is helpful, Fiaz.
This is great walkthrough.. thank you so much.
You’re very welcome, Modammad. Glad it helps!