In Six Sigma projects, we use financial measures to analyze the wider effects of our efforts. Looking at the number of defects is ideal for identifying issues. However, it’s very low-level and narrowly focused. It doesn’t help us measure the final impact of process changes. It also won’t mean much to stockholders and board members. That’s why we also need to use financial measures.
There are two basic types of financial measures we can use:
- Forward-looking measures: These help us figure out whether or not a project will be worthwhile.
- Backward-looking measures: These help us to measure the financial effect of our recent projects.
Returns
This category of metrics looks at the income received vs. the effort made and the assets owned. They’re backward-looking measures. In other words, they’re generally calculated after a project ends.
ROI
Return on Investment (ROI) = Gain realized / Effort spent.
This metric measures how efficient and profitable an endeavor (project, program, etc.) is. You could build a valuable product but spend too much money to get it.
ROI = ((end value – cost) / cost)
where:
- ROI = Return on Investment.
- End value = Final value of the project.
- Cost = the amount of money spent on the project.
Example ROI calculation
For example, a software company is creating a piece of software. It pays four developers and testers for a year to complete the product at a cost of $250,000. It pays a marketer $50,000 for six months to create the marketing campaign. 300 customers subscribe to pay $200 a month for access to the software in the first year after the product is released.
ROI = (end value – cost) / cost
ROI = ((300 x 200 x 12) - 300000) / 300000
ROI = (720000 - 300000) / 300000
ROI = 420000 / 300000
ROI = 1.4 = 140%
ROA
Return on Assets (ROA) = Income / Assets.
This metric measures how efficient management is in turning its holdings into earnings. It compares the company’s income with the assets it owns. Is it using those assets effectively to gain more income?
ROA = (income / assets)
Where:
- ROA = Return on assets.
- Income = The company’s net income.
- Assets = The current valuation of the company’s assets.
Example ROA calculation
The software company in the example above owns a server farm that delivers its software. Its current valuation is $200,000. So we plug that figure and its earnings into the ROA formula.
ROA = income / assets
ROA = 420000 / 200000
ROA = 2.1 = 210%
Using ROI and ROA
ROI and ROA are useful in Six Sigma because they help us gauge the success of completed projects.
Cost-Benefit Analysis
This is a forward-looking measure. It involves looking at the projected costs and returns of a project. It gives us data that we need to decide whether a project is worth doing. But it’s not just useful within a team. You can use a cost-benefit analysis to demonstrate the value of a project to people outside your team, like upper management.
From a financial standpoint:
- If the cost exceeds the benefit, the project isn’t worthwhile.
- If the benefit is substantially greater than the cost, the project is worthwhile.
How to conduct a cost-benefit analysis
There are three basic steps to conducting a cost-benefit analysis:
- Calculate the expected costs of the project. Include one-time costs like design and implementation resources, ongoing costs like training and new equipment, and the cost of capital expenses.
- Calculate the projected benefit of the project. This might include new one-time revenue, like customers buying a product, or ongoing benefits, like reducing weekly hours spent on specific tasks at $/hr.
- Determine the cost vs. benefit ratio.
Cost-Benefit Analysis formula
CBA = (Cost / Benefit)
Where:
- Cost = the projected cost of the project
- Benefit = the projected return of the project
Example cost-benefit analysis calculation
We can conduct a retrospective CBA on the software company that we looked at earlier.
CBA = Cost / Benefit CBA = 300000 / 420000 CBA = 0.714 = 71.4%
Learn more about cost-benefit analysis here and how to perform one here.
Net Present Value (NPV)
Projects rarely deliver only simple, one-time costs and returns. Often the costs and returns associated with a project will continue for years. The value of these costs and returns will change each year thanks to inflation. Today’s dollar will be worth more than one dollar in five years.
We use NPV to calculate the present value of future costs and returns.
Net Present Value formula
NPV = Rt / (1 + i)t
Where:
- NPV is the net present value.
- Rt is the net cash flow for the period.
- i is the discount rate: the return that could be made on an investment with a similar risk profile.
- t is the period of time.
Internal Rate of Return (IRR)
We can use the Internal Rate of Return for each year’s cash flow to determine the projected percentage return from a project.
The higher the IRR, the better. Generally, a company will compare the IRR to the expected return from an investment with a similar risk profile. If the project’s IRR is a lot higher than the comparison investment return, it’s a winner. If it’s lower, then from a financial perspective, proceeding doesn’t make sense.
Note: Expected financial returns aren’t the only reason to go ahead with a project. There might be social or environmental returns that outweigh the financial aspect. However, most organizations will need to understand the financial measures thoroughly.
IRR formula
0 = P0 + P1/(1+IRR) + P2/(1+IRR)2 + P3/(1+IRR)3 + . . . +Pn/(1+IRR)n
Where:
- P0 = the immediate cash flow (usually a negative figure).
- P1 = the projected cash flow in the first year.
- P2 = the projected cash flow in the second year.
- P3 = the projected cash flow in the third year.
- Pn = the projected cash flow in the nth year.
- IRR = the Internal Rate of Return.
This is complicated to solve manually, but you can utilize Excel with built-in IRR formulas.
Example IRR scenario
A company is considering moving its software product into the cloud. It’s calculated that the initial cost would be around $50,000, and annual maintenance and upgrade costs would be about $10,000 thereafter. But it’s also figured that it would no longer need to maintain a bank of servers to host the development and production environments (a saving of around $100,000 over five years) and would save around $ 5,000 a year currently being offered in discounts to customers when server outages occur (estimated at once per year).
Its IRR equation would look something like this:
0 = P0 + P1/(1+IRR) + P2/(1+IRR)2 + P3/(1+IRR)3 + . . . +Pn/(1+IRR)n
P0 is straightforward at -$50,000.
Fortunately, P1 P2 P3 P4 P5 are all the same. Let’s show how to calculate that.
The problem states that there is a $10k maintenance cost each year, that they’d save $100k over 5 years (or $20k each year), and that there is an additional savings of $5k each year for discounts.
That makes Pn = -$10k + $20k + $5k = $15k
0 = -50000 + 15000/(1+IRR) + 15000/(1+IRR)2 + 15000/(1+IRR)3 + 15000/(1+IRR)4 + 15000/(1+IRR)5
In Excel, we’d add the key data:
| A | B | |
| 1 | Year | Cash flow |
|---|---|---|
| 2 | 0 | -50000 |
| 3 | 1 | 15000 |
| 4 | 2 | 15000 |
| 5 | 3 | 15000 |
| 6 | 4 | 15000 |
| 7 | 5 | 15000 |
Then we’d use the following Excel formula to calculate the IRR:
=IRR(B2:B7)
Which Excel calculates as 15%.
A fair investment return for 5 years is 10%. So a 15% projected return gives extra value, and will probably be accepted as a worthwhile venture.
Payback Period
Payback is one of the most useful capital budgeting methods. It is generally used to evaluate the project by considering the associated risks before investing. The Payback Period calculates the years after the initial investment amount will be recovered from a project’s net cash inflows. In other words, the length of time the initial investment outlay reaches a breakeven point. Invest in a project where payback is less than the maximum allowed time.
Payback period formula
The formula for the payback period depends on fixed and irregular cash flow.
- Case 1: Fixed cash inflow: Payback period = Initial investment/Net cash inflows per period
- Case 2: Irregular cash inflow: Payback period = Last time period with negative net cash flow+ (Net cash flow at the time of last negative value/ cash flow of the consecutive year)
Payback period example
Example 1: Fixed or even cash flow Method: A manufacturing plant is planning to start a new project with an initial investment of $115 million. Management expects returns of $20 million per year in net cash flows for 8 years. Calculate the payback period of the new project.
Initial investment = $115 million
Cash flow per year = $20 million
Number of years = 8
Payback period = Initial investment / Net cash flow per period = $115/$20 = 5.75 years.
Example 2: Irregular or uneven cash flow method: A manufacturing plant is planning to start a new project with an initial investment of $80 million. Management expects returns of $15 million in the first year, $20 million in the second year, $25 million third year, $35 million in the fourth year, and $20 million in the fifth year. Calculate the payback period.
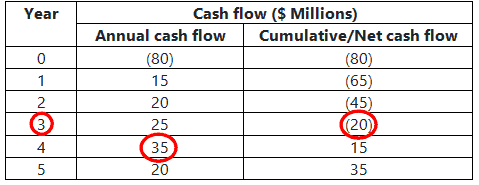
Payback period = Last time period with negative net cash flow + (Net cash flow at the time of last negative value/ cash flow of the consecutive year) = 3+(20/35) = 3+0.57=3.57 years.
Advantages of the Payback Period
- The Payback method is very easy to understand and calculate the period
- It considers the organization’s liquidity and helps to find the project that provides quick returns.
- Accounts for the inherent project risks and favors the best-ranked projects
Disadvantages of the Payback Period
- The Payback Period does not consider the time value of money
- It does not account for the cash flows after the payback period
Payback period videos
Revenue Growth
Revenue growth refers to an increase in revenue over a period of time. In other words, revenue growth is a financial metric that measures the increase in an organization’s total sales or revenue over a specific period of time.
It is a key indicator of a business’s performance and is often used to assess the company’s ability to generate income and expand its operations. The below formula indicates the percentage of change in revenue over the given period. The formula for calculating revenue growth is:
Revenue Growth = (Revenue at the End of Period−Revenue at the Start of Period)*100/ Revenue at the Start of Period
A positive revenue growth percentage indicates an increase in sales, while a negative percentage reflects a decrease.
Example: Let’s say an IT start-up made revenue of $750,000 in 2021 and the revenue is increased to $1 million in 2022. The revenue growth from 2021 to 2022 is:
($1,000,000 – $750,000) / $750,000 =33.3%
The IT company’s revenue growth from the year 2021 to 2022 is 33.3%.
Market Share
Market share represents the portion of total sales within n a particular market that is captured by a specific company or product over a specified period. The market share metric serves as a pivotal gauge of an organization’s competitiveness, positioning it relative to other entities within the same industry or market segment.
To compute market share, the organization’s sales or revenue for the period are divided by the total sales or revenue of the industry during the corresponding timeframe.
Market share = (Organization’s sales or revenue)*100/ Total market sales or revenue
Market share metric holds paramount significance for businesses and investors, offering invaluable insights into market dynamics, competitive standing, and identifying potential areas for growth and enhancement.
Example: A company sold $27 million worth of yogurts in the year 2021 domestically, and the total amount of yogurt sold in the U.S. was $200 million, the company’s U.S. market share would be 13.5%
Margin
Margin in a business context is the difference between the selling price of a product and the expenses incurred in its production and sales. In other words, an organization’s margin reflects the proportion of profit relative to its overall revenue.
Understanding and optimizing this margin is crucial for businesses in their journey toward success. Even if a company is generating substantial revenues, the presence of elevated operating costs can result in weakened profit margins. Different types of margins are gross margin, net margin, operating margin, etc.
When profit margins are disproportionately low, businesses are compelled to explore the opportunities for cost reduction or revenue enhancement to increase the portion of profit relative to their overall revenues.
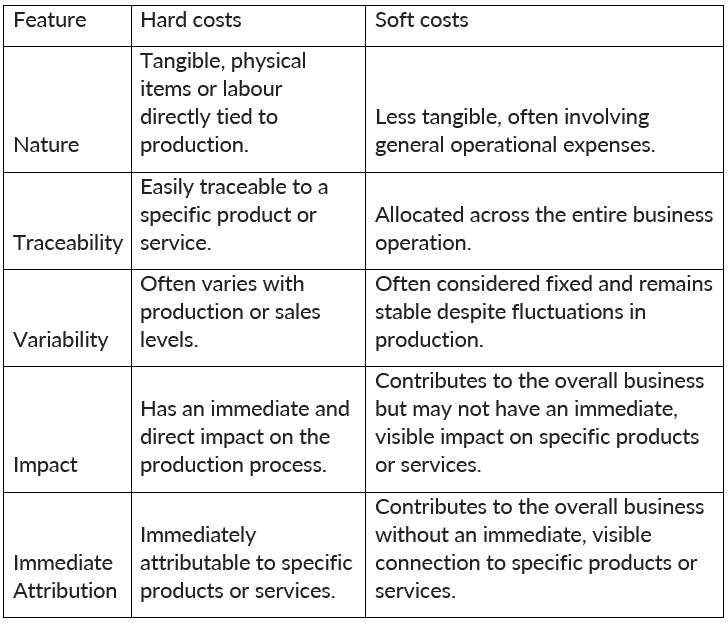
Hard Cost Vs Soft Cost
Hard costs, also known as direct costs, are tangible and quantifiable expenses directly associated with the production or sale of goods and services. These costs can be easily traced to a specific product or service.
Examples: Raw materials, labor costs directly tied to production, manufacturing equipment, shipping costs, and direct overhead expenses.
Soft costs, also known as indirect costs or overhead, are less tangible and often more challenging to attribute directly to a specific product or service. These costs are essential for business operations but do not have a direct and immediate link to production.
Examples: Administrative salaries, rent, utilities, marketing expenses, training costs, and other general overhead expenses.
Furthermore, achieving cost reduction through a project provides tangible or hard savings, effectively diminishing the organization’s cash outflow, which is reflected in the financial statements.
On the other hand, cost avoidance, constituting intangible or soft savings, is a benefit derived from a project by preventing potential future costs. As cost avoidance doesn’t impact current cash flows, it remains unreflected in the financial statements.
Six Sigma Green Belt Certification Financial Measures in Six Sigma Questions:
Question 1:
A shoe manufacturing firm learned through a Lean Six Sigma project that their boot soles could be made of a different material requiring two fewer steps in the process. Removal of these two steps yielded a monthly cost savings of $7,500. Therefore the reported financial savings for this LSS project were:
A) $45,000
B) $75,000
C) $90,000
D) $120,000
I find it easiest to translate each of the options into actual English to answer this question.
(A) Benefits / (investment+cost) > 0
(B) Benefits / (investment+cost) > 1
(C) Benefits / (investment+cost) <= 1
(D) Benefits / (investment+cost) <= 0
It seems that it’s clearly an ROI question. We would reject C & D because we want the return to be positive–we don’t want to lose money here! Similarly, we know the ROI has to be greater than 1 for us to make money on the deal. Anything less than 1 means that the total costs outweigh the benefits, so the answer cannot be A. Option B is correct.
Question 3:
A Six Sigma project to reduce billing statement expenses has shown the need to hire two additional mailroom clerks. Based on this information, which of the following metrics should be used to measure the project’s financial benefits? (Taken from ASQ sample Black Belt exam.)
(A) Cost of poor quality
(B) Return on investment
(C) Net present value
(D) Internal rate of return
Answer:
B: ROI. It is one of the financial measures metric. The problem states that there is a cost to our project – the additional headcount needed. Also, we want to compare that against the project’s proposed savings before going forward.
Comments (12)
Hey, so as I understand it, the Cost/Benefit Analysis seems to be the inverse of the Return On Investment. I am wondering in your example of CBA what exactly does the result of “71.4%” exactly mean if you were to phrase that in a sentence? How would you put that figure in Layman’s terms?
Your ROI example is clear and can be articulated. In your example, “if you invested $300,000, you would get a gross return of $420,000 which would be 140% return on your investment.”
I don’t know how your CBA example would be used in an every day situation.
Thanks
* I meant to put “Net return” instead of gross return. Sorry
Hi Alex,
Thanks for the question. On the surface of the calculations you are correct. Let me add detail.
In general a CBA is more far-reaching than a ROI calculation. The CBA calc there is generally all that is typically asked in questions on the exam but you can consider CBA as part of evaluating a portfolio of possible projects / programs. Here’s more.
In general a CBA is more far-reaching than a ROI calculation. The CBA calc there is generally all that is typically asked in questions on the exam but you can consider CBA as part of evaluating a portfolio of possible projects / programs. Here’s more.
Hello Ted, the “here’s more” link you provided says that ” Like an ROI calculation, the result of CBA is a ratio expressed as a percentage, and economic attractiveness is determined the same way: above zero is attractive, and below zero is not. The equation is the same, although more costs and benefits are included. That is the essential difference between the two methods. But the sample ASQ question you provided, gave the answer as greater than one, not greater than zero. Pasting it here from above:Question: A six sigma team has gathered data for a project proposal and is using the following notations:
I = Initial investment
C = Periodic maintenance cost
B = Benefits to be accrued
On the basis of the information above, which of the following is the criteria used to select a project? (Taken from ASQ sample Black Belt exam.)
(A) B / (I+C) > 0
(B) B / (I+C) > 1
(C) B / (I+C) <= 1
(D) B / (I+C) 0
(B) Benefits / (investment+cost) > 1
(C) Benefits / (investment+cost) <= 1
(D) Benefits / (investment+cost) <= 0
It seems that it’s clearly an ROI question. We would reject c & d because we want the return to be positive – we don’t want to lose money here! Similarly, we know the ROI has to be greater than 1 for us to make money on the deal. Anything less than 1 means that the total costs outweigh the benefits, so the answer cannot be a. Option B is correct.
Can you please tell me which is the correct answer? Isn't 50 cents more than zero? is 1 considered a dollar? is that where my thinking is confused. I've seen this answer be different before as well, so look forward to getting clarity, kind regards, Barbara
Hi Barbara,
The key difference is in how the ASQ question above states the equation and how the PDF linked to state it. ASQ infers total benefits while the PDF states NET benefits.
The ASQ question states Benefits / (Investment + Costs) and infers total benefits.
If you are using a Net Benefit ROI equation you would select any positive number.
If you are using a Total Benefit ROI equation, like in the one above, you would use any # > 1.
Best, Ted
Hi,
I have a concern about the last question, I believe that NPV and ROI can both be metrics to calculate the benefits.
Can you explain the reasoning why the answer is ROI?
Thanks,
Hi Ahmed,
You are correct that both could be metrics to calculate benefits. I like the following explanation.
Best, Ted
Isn’t income in your ROA example 720,000?
Hello Richard
ROA = Net Income/ Avg total assets
Net income is the amount of total revenue that remains after accounting for all expenses. Hence it is 420000 only.
Thanks
Hi Ted,
I’m bit confused about the example of IRR? Could you help me to find the path of finding 15000 for P1 and the rest?
Thanks for the question, Eda. I’ve updated the example above.
Does that help make it more clear?
Definitely Ted!
Thanks