What is Binomial Distribution?
A Binomial Distribution describes the probability of an event with only two possible outcomes. For example, Heads or Tails.
It can also be used to describe the probability of a series of independent events that only have 2 possible outcomes occurring. For example: Flipping a coin 10 times and having it land with 5 on heads exactly 5 times. Or, flipping a coin 10 times and having it land on heads at least 5 times.
Furthermore, the probability of an event with n trials and f failures follows a binomial distribution.
Visualizing Binomial Distribution
The Binomial Distribution looks like so when graphed:

By Tayste – Own work, Public Domain, Link
When Would You Use Binomial Distribution?
Requirements and Conditions for a Binomial Distribution
- Must be a fixed number of trials.
- Continuous data are not binomial.
- The probability of success should be the same on every trial, and also, the probability of success is constant.
- Two states–Two possible outcomes.
- (true or false, hot or cold, success or failure, defective or not defective.)
- Independent trials – trials are statistically independent.
- (For example: The flip of one coin means nothing to the results of the next coin flip.)
- Use Binomial Distribution when you are sampling with replacement.
You Cannot Use Binomial Distribution On:
- When the probability of success is not constant for an event.
- Ex. The probability of it snowing or not snowing in NYC would not fit the criteria for a Binomial Distribution because the probability of success is not constant. The chance of snow on winter days is higher than on summer days.
- When you sample WITHOUT replacement.
- In that case, use Hypergeometrics.
Cumulative vs. Non-Cumulative
There are (2) ways I’ve seen Binomial Distribution Problems be represented in Six Sigma Exams:
- Non-cumulative questions
- Cumulative questions (with or without a chart)
The questions can either be about the actual equations, like translating a word problem into an actual solution. Or they can be about the necessary scenarios when you would apply binomial probability – in other words, what MUST be true to use it, or if an event is binomial, what can we infer about its properties?
Non-Cumulative Probability
This is just a fancy statistics term for single events taken on their own.
Example: a single flip of a coin.
Cumulative Probability
Another fancy statistics term for multiple events. I like to remember that Cumulative events literally accumulate multiple probabilities.
One thing to be aware of is that you can be asked to either manually calculate a binomial cumulative probability question or you could be used to leverage a chart.
Notes About Sampling With Replacement
The Binomial is for N trials and F failures. It describes the probability of k successes in n draws with replacement from a finite population of size N containing exactly K successes.
Remember, the binomial is for independent events where the likelihood of each event occurring is the same as the others. If you sample without replacing, you’re affecting the likelihood of independence.
This contrasts the hypergeometric distribution, which describes the probability of k successes in n draws when sampling without replacement.
Examples of Binomial Distribution Problems
Non Cumulative Binomial Probability
Non-Cumulative Calculation Example 1: “Contains Exactly”
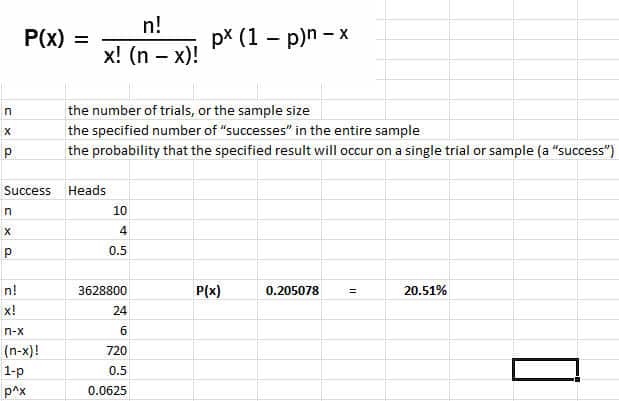
If a coin is tossed 10 times, what is the probability of obtaining exactly four heads? (If an honest coin is tossed 10 times, what is the probability of 4 heads?)
With a coin toss, there are only 2 possible outcomes; heads or tails. So you should be on alert for using a binomial.
Non-Cumulative Calculation Example 2: “Contains Exactly”
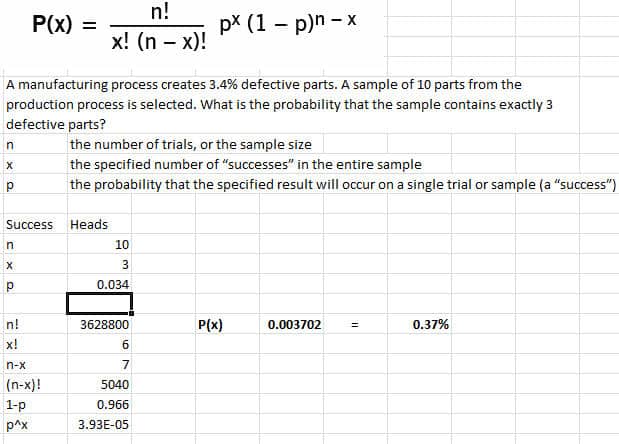
A manufacturing process creates 3.4% of defective parts. A sample of 10 parts from the production process is selected. What is the probability that the sample contains exactly 3 defective parts?
When you see the word defective, you should be alert to use the Binomial equation. Since defect, in this sense, means that a part is in a binary state, either functioning or defective, it meets our criteria.
Non-Cumulative Calculation Example 3: “Contains Exactly”
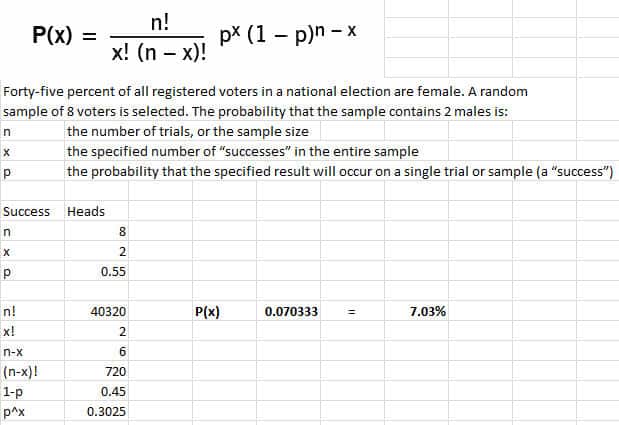
Forty-five percent of all registered voters in a national election are female. A random sample of 8 voters is selected. The probability that the sample contains 2 males is:
Since this question assumes that there are (2) biological genders measured, male or female, you should be on alert to use the binomial distribution.
Non-Cumulative Chart Example:
You can see that the same percentage was found on the chart. (In this case, x is the probability of the event happening instead of p.)
Examples of Cumulative Binomial Probability Questions
Cumulative Calculation Example: “At least” or “Fewer Than” or “At Most”
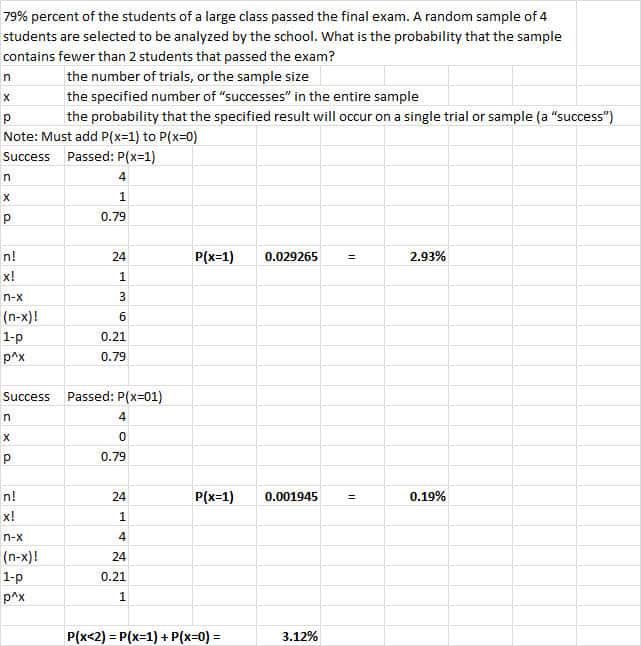
79% percent of the students of a large class passed the final exam. A random sample of 4 students is selected to be analyzed by the school. What is the probability that the sample contains fewer than 2 students that passed the exam?
Since we are examining data that only has a binary state, pass or fail, you should be on alert to use the binomial equation.
Also, since you’ve asked for ‘x or fewer,’ you must calculate the probability of ALL POSSIBLE events.
In this example, we must calculate the odds of EXACTLY one pass PLUS the odds of EXACTLY no pass in the sample.
Cumulative Calculation Example: “More than”
An example of this kind of question is “Test the probability of the number of dropped calls will exceed a certain number.”
Here you’d do the opposite of the “Fewer” example above and count the probabilities.
So, if we rewrote the question above to be ‘What’s the probability of sampling 10 students and 8 or more passed,’ it would be the probability of EXACTLY 8 passing, PLUS EXACTLY 9 passing, PLUS EXACTLY 10 passing.
Binomial Probability Questions Short Cuts
This can be a LOT of calculations. Fortunately, there are some shortcuts:
Factorial Math Shortcuts:
I find that many of these binomial questions can be made easier by reducing the factorials by canceling out terms before you plug them into the calculator.
Just for the sake of simplicity, let’s say that you have 5! / 3! If you write that out by hand, it’s essentially (5*4*3*2*1 / 3*2*1). Also, you can eliminate a lot of the terms by recognizing this and rewriting 5! / 3! as 5*4.
Distribution table Shortcuts:
Binomial Probability Charts
Here are some good references:
- https://www.statisticshowto.datasciencecentral.com/tables/binomial-distribution-table/
- http://www.math.hawaii.edu/~xander/fa12_471/Binomial_Probabilities.pdf
Binomial Chart Question Example: (Without Calculations)
- If I were using a Binomial Distribution Table, which values of X would I add together to get the probability of at most N defective?
- You would add the probabilities of N, n-1, n-2… all the way to zero.
- For Example, “Which values of X would I add together to get the probability of at most 4 defective?”
- Add the probabilities of 4 + 3 + 2 +1 + 0.
Binomial Chart Question Example: (“More Than”)
Let’s assume that 20% of drivers on the road have NO car insurance. What is the probability that more than 7 out of a sample of 15 people have no car insurance?
- Find n = 15 in the first column on the left.
- And then, find the column containing p = 0.20.
- Find the 7 in the second column on the left since we want to find F(7) = P(X ≤ 7).
Now, all we need to do is read the probability value where the p = 0.20 column and also the (n = 15, x = 7) row intersect. What do you get?
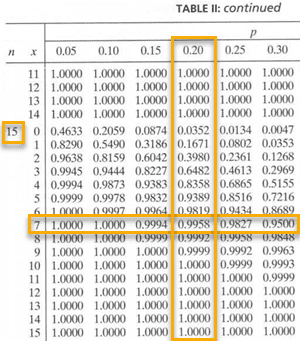
So, the cumulative binomial probability table tells us that P(X ≤ 7) = 0.9958. Therefore: P(X > 7) = 1 − 0.9958 = 0.0042
That is, the probability that more than 7 in a random sample of 15 would have no car insurance is 0.0042
Example of Using Binomial Probability in a Six Sigma Project
Typically in a Six Sigma project, you are using DMAIC methodology. Let’s say during the Define Phase you chartered a project to see if you could improve a process that had a binomial outcome. You might even use the Binomial Distribution to articulate the business case for why you should do the project in the first place–for instance, event A should be binomial, but it’s clearly not.
You might use the binomial distribution to see if samples of the process outcome followed a binomial distribution during the Analysis phase.
If you are running a pilot implementation during the Improve Phase, you might make the assumption that some events that are inputs to your process in fact will follow a binomial distribution.
Also, In the Control Phase, you might monitor that a specific process generates binomially distributed results if it should.
What You Need to Know for Certification
Six Sigma Green Belts
The ASQ Six Sigma Green Belt BOK requires:
Probability distributions
Describe and interpret normal, binomial, and Poisson, chi square, Student’s t, and also F distributions. (Apply)
Six Sigma Black Belts
The ASQ Six Sigma Black Belt BOK Requires:
Describe, apply and interpret the following distributions: normal, Poisson, binomial, chi square, Student’s t and F distributions. (Evaluate)
The Villanova Six Sigma Black Belt BOK requires the following
Advanced statistical process control
Distributions commonly used by black belts. Describe and apply binomial, Poisson, normal, chi-square, Student’s t, and F distributions.
Videos on Binomial Distributions
Additional Helpful Resources
Hypothesis Testing with Binomial Distribution

Comments (15)
I think there is a typo:
Cumulative
Order of when they happen does not matter.
Non Cumulative
Order of when they happen does not matter.
did you mean:
Cumulative
Order of when they happen does matter.
Non Cumulative
Order of when they happen does not matter.
Thanks for building this resource!
Yes, thank you Amy. Very much appreciate the proof reading!
The Cumulative Calculation Example is missing
Sorry, Nicolle. I’ll add that to the list to update.
TED can you please update Cumulative calculation example & Cumulative chart example are still missing.
Hi Akbar,
I’ve added that to my to-do list.
Best, Ted.
This is now complete. Take a look!
Hi All,
This article has been completely re-written and is much more comprehensive and hopefully more helpful.
Let me know how it goes!
Best, Ted.
Hi Ted,
Is Binomial Distribution needed for IASSC?
I don’t see it specifically in the IASSC Green Belt BOKIASSC Green Belt BOKIASSC Green Belt BOK, but they do list Statistics as being a core need. I find it worthy to master because a) it may be on the exam and b) understanding the concept is integral to industry expectations for green belt holders.
Does IASSC allows using excel in the exam ? or am i required to memorize the formula ?
Hi Ahmed,
The IASSC provides an equation sheet and that’s the only reference you are able to use.
If you’ve registered for an exam with them, they should be able to give you a copy to practice with.
Best, Ted.
Thanks Ted
What does the broken bar “¦” mean? I don’t see anything about it here, but then in some practice quiz explanations you include it.
E.g. Probability Distributions (GB Measure) (15)
P(5 successful shots out of 5 tries) = (5¦5) (0.856^5)(0.144^(5-5)) =(5!/(5!)) (0.856^5)(0.144^0) = .4595 =46%
P(1 green out of two games) + P(2 green out of two games) = (2¦1) (0.3^1)(0.7^(2-1)) + (2¦2) (0.3^2)(0.7^(2-2)) =(2) (0.3^1)(0.7^1) +(1) (0.3^2)(0.7^0)= 0.42+0.09= 0.51
Is it notation to refer to simplified factorials?
Hi Owen,
Yes, the notation was for factorial and I can see how that would be confusing. I’ve updated it in the answer sets.
Thanks, Ted.